00:00 Introduction
02:49 Demand, price and profit
09:35 Competitive prices
15:23 Wants vs needs
20:09 The story so far
23:36 Directions for today
25:17 The unit of need
31:03 Cars and parts (recap)
33:41 Competitive intelligence
36:03 Solving the alignment (1/4)
39:26 Solving the alignment (2/4)
43:07 Solving the alignment (3/4)
46:38 Solving the alignment (4/4)
56:21 Product ranges
59:43 Unconstrained parts
01:02:44 Controlling the margin
01:06:54 Display ranks
01:08:29 Fine-tuning the weights
01:12:45 Fine-tuning compatibilities (1/2)
01:19:14 Fine-tuning compatibilities (2/2)
01:30:41 Counterintelligence (1/2)
01:35:25 Counterintelligence (2/2)
01:40:49 Overstocks and stockouts
01:45:45 Shipping conditions
01:47:58 Conclusion
01:50:33 6.2 Pricing Optimization for the Automotive Aftermarket - Questions?
Description
The balance of supply and demand very much depends on prices. Thus, pricing optimization belongs to the realm of supply chain, at least to a sizeable extent. We will present a series of techniques to optimize the prices of a fictitious automotive aftermarket company. Through this example, we will see the danger associated with abstract lines of reasoning that fail to see the proper context. Knowing what ought to be optimized is more important than the fine print of the optimization itself.
Full Transcript

Welcome to this series of supply chain lectures. I am Joannes Vermorel, and today I will present pricing optimization for the automotive aftermarket. Pricing is a fundamental aspect of supply chain. Indeed, one cannot ponder the adequacy of a given volume of supply or a given volume of inventory without considering the question of prices, as prices significantly impact demand. However, most supply chain books, and consequently, most supply chain software, ignore pricing altogether. Even when pricing is discussed or modeled, it is usually done in naive ways that often misinterpret the situation.
Pricing is a highly domain-dependent process. Prices are first and foremost a message sent by a company to the market at large - to customers, but also to suppliers and competitors. The fine print of pricing analysis depends heavily on the company of interest. While approaching pricing in general terms, as microeconomists do, can be intellectually appealing, it can also be misguided. Those approaches may not be precise enough to support the production of professional-grade pricing strategies.
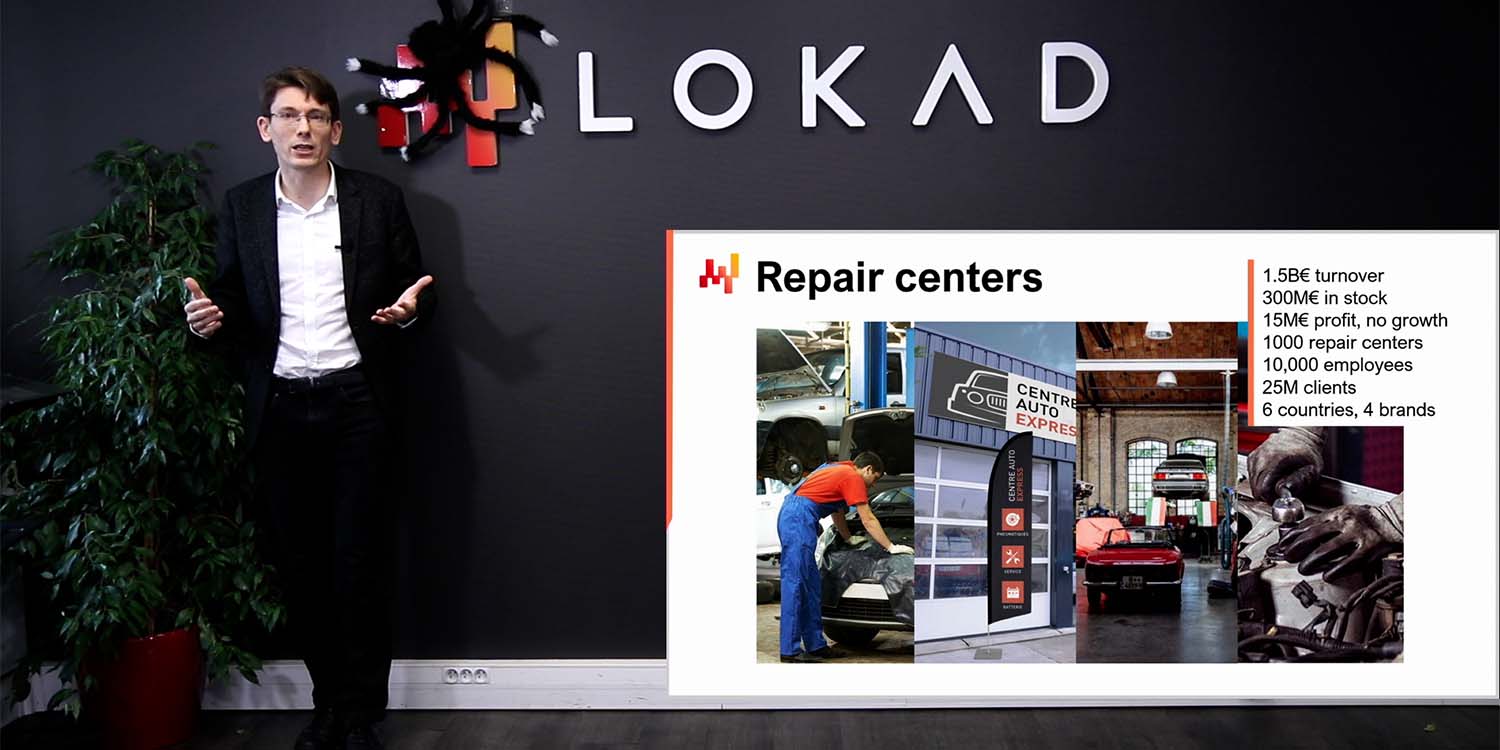
This lecture focuses on pricing optimization for an automotive aftermarket company. We’ll be revisiting Stuttgart, a fictitious company introduced in the third chapter of this series of lectures. We will focus exclusively on the online retail segment of Stuttgart that distributes car parts. The goal of this lecture is to understand what pricing entails once we look past the platitudes and how to approach pricing with a real-world mindset. Although we will be considering a narrow vertical - spare car parts for the automotive aftermarket - the line of thinking, mindset, and attitude adopted in this lecture while pursuing superior pricing strategies would essentially be the same when considering entirely different verticals.

The demand diminishes as the price increases. This is a universal economic pattern. The very existence of products that contradict this pattern remains elusive at best. These products are called Veblen goods. However, in 15 years at Lokad, even when dealing with luxury brands, I’ve never gained access to any tangible proof that such products actually exist. This universal pattern is illustrated by the curve on the left of the screen, generally called a demand curve. When a market settles on a price, for example, the price of a spare car part, this market generates a certain volume of demand and hopefully a certain volume of profit as well for the actors that fulfill this demand.
As far as automotive spare parts are concerned, these parts are definitively not Veblen goods. The demand does diminish as the price increases. However, as people don’t have much choice in buying car parts, at least if they want to keep driving their cars, the demand can be expected to be relatively inelastic. A higher or lower price point for your brake pads isn’t really altering your decision on buying new brake pads. Indeed, most people would rather buy new brake pads, even if they have to pay twice the usual price for them, rather than stop using their vehicle altogether.
For Stuttgart, identifying the best price tag for every part is critical for a myriad of reasons. Let’s explore the two most obvious ones. First, Stuttgart wants to maximize its profits, which is non-trivial as not only does the demand vary with the price, but cost also varies with the volume. Stuttgart must be capable of fulfilling the demand that it will generate in the future, which is even more non-trivial, as the inventory must be secured days ahead, if not weeks ahead, due to lead-time constraints.
Based on this limited exposition, some textbooks, and even some enterprise software, proceed with the curve illustrated on the right. This curve conceptually illustrates the expected volume of profit that can be anticipated for any price tag. Given that the demand diminishes as the price increases, and the per-unit cost decreases as the volume increases, this curve should exhibit an optimal profit point that maximizes profit. Once this optimal point is identified, adjusting the inventory supply is presented as a straightforward matter of orchestration. Indeed, the optimal point provides not only a price tag but also a volume of demand.

However, this perspective is profoundly misguided. The problem has nothing to do with the difficulty of quantifying elasticity. My proposition is not that the curve on the left is incorrect; it is fundamentally correct. My contention is that the leap from the curve on the left to the curve on the right is incorrect. In fact, this leap is so astonishingly wrong that it serves as a sort of litmus test. Any software vendor or pricing textbook that presents pricing in this way demonstrates a dangerous degree of economic illiteracy, especially if they present the assessment of elasticity as the central challenge associated with this perspective. This is not even remotely close to being the case. Trusting a real-world supply chain to such a vendor or expert invites pain and misery. If there’s one thing your supply chain doesn’t need, it’s a flawed interpretation of misunderstood microeconomics at scale.
In this series of lectures, this is another instance of naive rationalism or scientism, which has proven time and again to be a significant threat to modern supply chains. Abstract economic reasoning is powerful because it captures a bewildering range of situations. However, abstract reasoning is also susceptible to gross misinterpretations. Major intellectual errors that are not immediately apparent can occur when thinking in very general terms.
To understand why the leap from the curve on the left to the curve on the right is incorrect, we need to take a closer look at what actually happens in a real-world supply chain. This lecture focuses on automotive spare parts. We will re-examine pricing from the viewpoint of Stuttgart, a fictitious supply chain company introduced in the third chapter of this series of lectures. We will not revisit the details of this company. If you haven’t already watched lecture 3.4, I invite you to do so after this lecture.
Today, we are looking at the online retail segment of Stuttgart, an e-commerce division that sells car parts. We are exploring the most appropriate ways for Stuttgart to determine its prices and revise them at any point in time. This task needs to be done for every single part sold by Stuttgart.

Stuttgart is not alone in this market. In every European country where Stuttgart operates, there are half a dozen notable competitors. This short list of companies, including Stuttgart, represents the majority of the online market share for car spare parts. While Stuttgart exclusively sells some parts, for most of the parts sold, there is at least one notable competitor selling the exact same part. This fact has significant implications for Stuttgart’s pricing optimization.
Let’s consider what happens if, for a given part, Stuttgart decides to put the price tag for this part one euro below the price tag offered by a competitor selling the same part. Conceivably, this will make Stuttgart more competitive and help capture market share. But not so fast. The competitor monitors all the prices set by Stuttgart. Indeed, the automotive aftermarket is a highly competitive market. Everyone has competitive intelligence tools. Stuttgart collects all the prices of its notable competitors daily, and the competitors do the same. Thus, if Stuttgart decides to put the price tag for a part one Euro below the price tag offered by a competitor, it is safe to assume that within a day or two, the competitor will have lowered its price tag in retaliation, nullifying Stuttgart’s price movement.
Although Stuttgart may be a fictitious company, this competitive behavior described here is not fictitious at all in the automotive aftermarket. Competitors aggressively align their prices. If Stuttgart repetitively tries to lower its prices, it will lead to an algorithmic price war, leaving both companies with little or no margin at the end of the war.
Let’s consider what happens if, for a given part, Stuttgart decides to put the price tag for this part one Euro above the price tag offered by a competitor. Assuming that everything else remains equal besides the price tag, Stuttgart is simply not competitive anymore. Thus, while Stuttgart’s customer base may not immediately leave for the competitor (as they might not even be aware of the price difference or they might remain loyal to Stuttgart), over time, Stuttgart’s market share is guaranteed to wither away.
There are price comparison websites available in Europe for car parts. While customers may not benchmark every single time they need a new part for their car, most customers will revisit their options once in a while. It is not a viable solution for Stuttgart to be invariably discovered as the more expensive dealer.
Thus, we have seen that Stuttgart cannot have a price tag below the competition, as it triggers a price war. Conversely, Stuttgart cannot have a price tag above the competition, as it guarantees erosion of its market share over time. The only option left for Stuttgart is to seek price alignment. This is not a theoretical statement—price alignment is the primary driver for real e-commerce companies selling car parts in Europe.
The intellectually appealing profit curve that we introduced previously, where companies could supposedly pick the optimal profit, is entirely bogus for the most part. Stuttgart doesn’t even have a choice when it comes to its prices. To a large extent, unless there is some sort of secret ingredient involved, price alignment is the only option for Stuttgart.
Free markets are a strange beast, as Engels put it in his 1819 correspondence: “Each individual will is obstructed by everyone else, and what emerges is something that no one willed.” We will see in the following that Stuttgart does keep some residual leeway to set its prices. However, the main proposition remains: pricing optimization for Stuttgart is first and foremost a heavily constrained problem, which has nothing in common with a naive maximization perspective driven by a demand curve.
The price elasticity of demand is a concept that makes sense for a market as a whole but usually not so much for something as localized as a part number.

The idea that pricing can be approached as a simple profit maximization problem leveraging the demand curve is bogus—or at the very least, it is bogus in the case of Stuttgart.
Indeed, the argument could be made that Stuttgart belongs to a market of needs, and the profit curves perspective would still work if we were considering a market of wants. In marketing, it’s a classic distinction to separate markets of wants from markets of needs. A market of wants is typically characterized by offerings where customers can opt out of their consumption without suffering negative consequences. In markets of wants, successful offerings tend to be strongly attached to the brand of the vendor, and the brand itself is the engine that generates the demand in the first place. For example, fashion is the archetype of markets of wants. If you want a bag from Louis Vuitton, then this bag can only be purchased from Louis Vuitton. Although there are hundreds of vendors selling bags that are functionally equivalent, they won’t be a bag from Louis Vuitton. If you opt out from buying a bag from Louis Vuitton, then nothing dire will happen to you.
A market of need is typically characterized by offerings where customers cannot opt out of their consumption without suffering bad consequences. In markets of needs, brands are not demand engines; they are more like choice engines. Brands guide customers in choosing from whom to consume once the need for consumption presents itself. For example, food and basic necessities are the archetype of markets of needs. Even if car parts are not strictly necessary to survive, many people do depend on a vehicle to earn money, and thus they cannot realistically opt out from properly maintaining their vehicle as the cost for them of the lack of maintenance would vastly exceed the cost of the maintenance itself.
Although the automotive aftermarket is firmly encamped in the market of needs, there are nuances. There are components like hubcaps that are more wants than needs. More generally, all the accessories are more wants than needs. Nevertheless, for Stuttgart, the needs drive the vast majority of the demand.
The critique that I am proposing here against the profit curve for pricing does generalize to nearly all situations in markets of needs. Stuttgart isn’t an outlier in being severely constrained price-wise by its competitors; this situation is nearly ubiquitous for markets of needs. This argument does not disprove the viability of the profit curve when considering markets of wants.
Indeed, it could be counter-argued that in a market of wants, if the vendor has a monopoly over its own brand, then this vendor should be free in picking whatever price maximizes its profit, bringing us back to the profit curve perspective for pricing. Once again, this counter-argument demonstrates the perils of abstract economic reasoning in supply chain.
In a market of wants, the profit curve perspective is also wrong, although for an entirely different set of reasons. The fine print of this demonstration is beyond the scope of the present lecture as it would require another lecture of its own. However, as an exercise left to the audience, I would simply suggest having a closer look at the list of bags and their prices put on display on the Louis Vuitton e-commerce website. The reason why the profit curve perspective is inappropriate should become self-evident. If not, well, we will most likely revisit this case in a later lecture.

This series of lectures is intended, among other things, as training materials for the supply chain scientists at Lokad. However, I also hope that these lectures may be of interest to a much wider audience of supply chain practitioners. I’m trying to keep these lectures somewhat decoupled, but I will be using a few technical concepts that have been introduced in the previous lectures. I won’t be spending too much time reintroducing these concepts. If you haven’t watched the previous lectures, don’t hesitate to have a look at them afterwards.
In the first chapter of this series, we explored why supply chains must become programmatic. It is highly desirable to put a numerical recipe in production due to the ever-increasing complexity of supply chains. Automation is more pressing than ever and there is a financial imperative to make supply chain practice a capitalistic undertaking.
In the second chapter, we dedicated time to methodologies. Supply chains are competitive systems and this combination defeats naive methodologies. We saw that this combination also defeats models that misinterpret or mischaracterize microeconomics.
The third chapter surveyed the problems encountered in supply chains, setting aside solutions. We introduced Stuttgart as one of the supply chain personas. This chapter attempted to characterize the classes of decision-making problems that need to be solved and showed that simplistic perspectives, like picking the right stock quantity, don’t fit real-world situations. There is invariably a depth to the form of the decisions to be made.
Chapter four surveyed the elements that are required to comprehend modern supply chain practices, where software elements are ubiquitous. These elements are fundamental in understanding the broader context in which the digital supply chain operates.
Chapters five and six are dedicated to predictive modeling and decision-making, respectively. These chapters collect techniques that work well in the hands of supply chain scientists today. The sixth chapter focuses on pricing, one type of decision that needs to be made among many others.
Finally, the seventh chapter is dedicated to the execution of a quantitative supply chain initiative and covers the organizational perspective.

Today’s lecture will be split into two broad segments. First, we’ll discuss how to approach competitive alignment on prices for Stuttgart. Aligning prices with those of competitors must be approached from the customer’s perspective due to the unique structure of the car spare part market. While competitive alignment is highly non-trivial, it does benefit from a relatively straightforward solution which we’ll cover in detail.
Second, while competitive alignment is the dominant force, it’s not the only one. Stuttgart may need or want to selectively deviate from this alignment. However, the benefits of these deviations must outweigh the risks. The quality of alignment depends on the quality of inputs used to build the alignment, so we’ll introduce a self-supervised learning technique to refine the graph of mechanical compatibilities.
Finally, we’ll address a short series of concerns that are pricing-adjacent. These concerns may not be strictly pricing, but in practice, they are best addressed jointly with prices.

Stuttgart needs to put a price tag on every single part it sells, but this doesn’t imply that pricing analysis must primarily be conducted at the part number level. Pricing is, first and foremost, a way to communicate with customers.
Let’s take a moment to consider how customers perceive the prices offered by Stuttgart. As we will see, the seemingly subtle distinction that exists between the price tag and the perception of the price tag is, in fact, not subtle at all.
When a customer begins looking for a new car part, usually a consumable part such as brake pads, they are unlikely to know the specific part number they need. There may be a few automotive aficionados who are deeply knowledgeable on the subject, to the point that they have a specific part number in mind, but they are a small minority. Most people only know that they need to change their brake pads, but they don’t know the exact part number.
This situation leads to another serious concern: mechanical compatibility. There are thousands of brake pad references available on the market, however, for any given vehicle, there are typically only a few dozen references that are compatible. Thus, mechanical compatibility cannot be left to chance.
Stuttgart, like all its competitors, is deeply aware of this problem. Upon visiting Stuttgart’s e-commerce website, the visitor is invited to specify their car model, and then the website immediately filters out the parts that aren’t mechanically compatible with the specified vehicle. Competitor websites follow the same design pattern: first pick the vehicle, then pick the part.
When a customer seeks to compare two vendors, they typically compare offerings, not part numbers. A customer would visit Stuttgart’s website, identify the cost of compatible brake pads, then repeat the process on a competitor’s website. The customer could identify the part number of the brake pads on Stuttgart’s website, and then seek the exact same part number on the competitor’s site, but in practice, people rarely do this.
Stuttgart and its competitors carefully craft their assortments so that they can serve nearly all vehicles with a fraction of the available automotive part numbers. As a result, they typically have between 100,000 and 200,000 part numbers listed on their websites, and only 10,000 to 20,000 part numbers actually held in stock.
With regard to our initial pricing concern, it’s clear that pricing analysis should primarily be conducted not through the lens of part numbers, but through the unit of need. In the context of the automotive aftermarket, a unit of need is characterized by the type of part that needs replacement and the model of the car that requires the replacement.
However, this perspective of the unit of need presents an immediate technical complication. Stuttgart can’t rely on one-to-one price matches between part numbers to align its prices with its competitors. Thus, pricing alignment isn’t as obvious as it might seem at first glance, especially when recognizing the constraints Stuttgart operates under from its competitors.

As we’ve already seen in lecture 3.4, the problem of mechanical compatibility between cars and parts is addressed in Europe, as well as other major regions worldwide, through the existence of specialized companies. These companies sell mechanical compatibility data sets, consisting of three lists: a list of car models, a list of car parts, and a list of compatibilities between cars and parts. This data set structure is technically known as a bipartite graph.
In Europe, these data sets typically feature more than 100,000 vehicles, over one million parts, and more than 100 million edges connecting cars to parts. Maintaining these data sets is labor-intensive, which explains why specialized companies exist to sell these data sets. Stuttgart, like its competitors, purchases a subscription from one of these specialized companies to access updated versions of these data sets. Subscriptions are necessary because, even though the automotive industry is mature, new cars and parts are continuously introduced. To stay closely aligned with the automotive landscape, these data sets need to be refreshed at least quarterly.
Stuttgart, and its competitors, use this data set to support the vehicle selection mechanism on their e-commerce websites. Once a customer has selected a vehicle, only the parts that are provably compatible with the chosen vehicle, according to the compatibility data set, are displayed. This compatibility data set is also foundational for our pricing analysis. Through this data set, Stuttgart can assess the price point offered for every unit of need.

The last significant missing ingredient to build Stuttgart’s competitive alignment strategy is competitive intelligence. In Europe, like in all major economic regions, there are competitive intelligence specialists—companies that provide price scraping services. These companies extract the prices of Stuttgart and its competitors daily. While a company like Stuttgart can attempt to mitigate the automated extraction of its prices, this endeavor is mostly futile due to several reasons:
First, Stuttgart, like its competitors, wants to be robot-friendly. The most crucial bots are the search engines, with Google, as of 2023, holding slightly above 90% market share. It’s not the only search engine, however, and while it might be possible to single out Googlebot, Google’s main crawler, it’s challenging to do the same for all the other crawlers that still make up about 10% of the traffic.
Second, competitive intelligence specialists have become experts over the last decade at masquerading as regular residential internet traffic. These services claim to have access to millions of residential IP addresses, which they achieve through partnering with apps, leeching off regular users’ internet connections, and partnering with ISPs (Internet Service Providers) that can lend them IP addresses.
Hence, we assume that Stuttgart benefits from a high-quality list of prices from its notable competitors. These prices are extracted at the part number level and updated daily. This assumption is not speculative; it’s the current state of the European market.

We’ve now gathered all the elements that Stuttgart needs to compute aligned prices - prices that match its competitors’ when considered from a unit of need perspective.
On screen, we have the pseudocode for the constraint satisfaction problem that we want to solve. We simply enumerate all units of need, i.e., all combinations of part types and car models. For each unit of need, we state that the most competitive price offered by Stuttgart should equal the most competitive price offered by a competitor.
Let’s quickly assess the number of variables and constraints. Stuttgart can set one price tag for each part number it offers, meaning we have about 100,000 variables. The number of constraints is a bit more complex. Technically, we have about 1,000 part types and about 100,000 car models, suggesting approximately 100 million constraints. However, not all types of parts are found in all models of cars. Real-world measurements indicate the number of constraints is closer to 10 million.
Despite this lower number of constraints, we still have 100 times more constraints than we have variables. We’re facing a vastly over-constrained system. Hence, we know that it’s unlikely we’ll find a solution that satisfies all the constraints. The best outcome is a trade-off solution that satisfies most of them.
Furthermore, competitors are not entirely consistent with their prices. Despite our best efforts, Stuttgart may end up in a price war over a part number due to its price tag being too low. Simultaneously, it may lose market share on the same part number due to its price tag being too high for another competitor. This scenario is not theoretical; the empirical data suggests these situations occur regularly, though for a small percentage of part numbers.
As we have opted for an approximate resolution of this system of constraints, we should clarify the weight to be given to each constraint. Not all car models are equal - some are associated with older vehicles that have almost entirely disappeared from the roads. We propose to weight these constraints according to the respective volume of demand, expressed in euros.

Now that we’ve established the formal framework for our pricing logic, let’s proceed with the actual software code. As we will see, the resolution of this system is more straightforward than expected.
On the screen, a minimal relational schema illustrates the six tables involved in this system. The rectangles with rounded corners represent the six tables of interest, and the arrows represent the one-to-many relationships between the tables.
Let’s briefly review these tables:
-
Part Types: As the name suggests, this table lists the types of parts, for example, “front brake pads.” These types are used to identify which part can be used as a replacement for another. The replacement part needs not only to be compatible with the vehicle but also have the same type. There are about a thousand part types.
-
Car Models: This table lists the models of cars, for example, “Peugeot 3008 Phase 2 diesel.” Each vehicle has a model, and all vehicles of a given model are expected to have the same set of mechanical compatibilities. There are about a hundred thousand car models.
-
Part Numbers (PNs): This table lists the part numbers that are found in the automotive aftermarket. Each part number has one, and only one, part type. There are about 1 million part numbers in this table.
-
Compatibility (Compat): This table stands for mechanical compatibilities and collects all the valid combinations of part numbers and car models. With about 100 million compatibility lines, this table is by far the largest.
-
Competition: This table contains all the competitive intelligence for the day. For every part number, there are half a dozen notable competitors that have the part number on display with a price tag. This results in about 10 million competitive prices.
-
Orders: This table contains past customer orders from Stuttgart over a period of about one year. Each order line includes a part number and a car model. Technically, it’s possible to purchase a car part without specifying the car model, although this is rare. Any order lines without a car model can be filtered out. Based on the size of Stuttgart, there should be about 10 million order lines.

We will now examine the code that loads the relational data. Displayed on the screen is a script that loads six tables, written in Envision - a domain-specific programming language designed by Lokad specifically for predictive optimization of supply chains. Although Envision has been created to increase efficiency and reduce errors in supply chain contexts, the script can be rewritten in other languages such as Python, albeit at the cost of increased verbosity and error risk.
In the first portion of the script, four flat text files are loaded. From lines 1 to 5, the file ‘path.csv’ provides both the part numbers and the part types, including the current prices displayed at Stuttgart. The field ’name is active’ indicates whether a specific part number is served by Stuttgart. In this first table, the variable ‘PN’ refers to the primary dimension of the table, while ‘PN type’ is a secondary dimension introduced by the ’expect’ keyword.
From lines 7 to 9, the ‘compat.tsv’ file supplies the part-vehicle compatibility list and the car models. This is the largest table in the script. Lines 11 to 14 load the ‘competition.tsv’ file, providing a snapshot of competitive intelligence for the day, i.e., the prices per part number and per competitor. The ‘orders.tsv’ file, loaded at lines 16 to 19, gives us the list of part numbers being purchased and the associated car models, assuming that all lines associated with unspecified car models have been filtered out.
Finally, at lines 21 and 22, the table ‘part types’ is set as upstream of the two tables, ‘compat’ and ‘orders’. This means that for every line in either ‘compat’ or ‘orders’, there is one and only one part type that matches. In other words, ‘PN type’ has been added as a secondary dimension to the tables ‘compat’ and ‘orders’. This first portion of the Envision script is straightforward; we’re simply loading data from flat text files and re-establishing the relational data structure in the process.

The second portion of the script, which is visible on the screen, is where the actual alignment logic occurs. This section is a direct continuation of the first part, and as you can see, it’s just 12 lines of code. We are once again using differentiable programming. For the audience who may not be familiar with differentiable programming, it is a fusion of automatic differentiation and stochastic gradient descent. It’s a programming paradigm that also extends to machine learning and optimization. In the context of supply chain, differentiable programming proves to be incredibly useful in various situations. Throughout this series of lectures, we have demonstrated how differentiable programming can be used to learn models, generate probabilistic demand forecasts, and achieve ballistic lead time forecasts. If you’re unfamiliar with differentiable programming, I recommend revisiting the previous lectures in this series.
In today’s lecture, we will see how differentiable programming is aptly suited to tackle large-scale optimization problems involving hundreds of thousands of variables and millions of constraints. Remarkably, these problems can be solved in just a few minutes on a single CPU with a few gigabytes of RAM. Additionally, we can use previous prices as a starting point, refreshing our prices instead of recalculating from scratch.
Please note a minor caveat. The keyword ‘join’ is not yet supported by Envision, but it is on our technical roadmap for the future. Workarounds exist, but for clarity, I will be using the future syntax of Envision in this lecture.
At line 24, we compute the smallest observed price across the market for each part number. If a part number is exclusively sold by Stuttgart and has no competitors, we use Stuttgart’s own price as a default.
From lines 26 to 30, for every part listed in Stuttgart’s customer order history, the current most competitive offering is computed.
At line 27, we iterate over each order line of the order table with ’each order’.
At line 28, we use ‘join pns’ to bring in the full part number table for each line of orders.
At line 29, we join with ‘others’, but this join is restricted by two secondary dimensions - model and part type. This means that for every line in orders, we select the part numbers that match a combination of part model and part type, reflecting the parts compatible with the unit of need matching the customer order.
From line 32 to 37, we resolve the alignment using differentiable programming, indicated by the keyword ‘Auto diff’. The ‘Auto diff’ block is declared on line 32, leveraging the ‘orders’ table as the observation table. This means we are implicitly weighting the constraints according to Stuttgart’s own sales volume. Lines 33 and 44 serve the same purpose as lines 28 and 29; they iterate over the ‘orders’ table, providing full access to the part numbers (‘PN’) table and a slice of the compatible entries.
At line 35, we declare ‘pns.price’ as the parameters to be optimized by the stochastic gradient descent. There’s no need to initialize these parameters, as we start from the prices used so far by Stuttgart, effectively refreshing the alignment.
At line 36, we compute ‘my price’, which is Stuttgart’s most competitive offering for the unit of need associated with the order line. This calculation is a mechanism quite similar to the computation of the lowest observed price, as done at line 24, once again relying on the list of mechanical compatibilities. The compatibilities are, however, restricted to part numbers that are served by Stuttgart. Historically, customers may or may not have selected the most economically advantageous part for their vehicle. Regardless, the purpose of using customer orders in this context is to assign weights to the units of needs.
At line 37, we employ the absolute difference between the best price offered by Stuttgart and the best price offered by a competitor to guide the alignment. Within this alternative block, gradients are retroactively applied to the parameters. The difference we find at the end forms the loss function. From this loss function, the gradients flow back to the sole parameter vector we have here: ‘pns.price’. By incrementally adjusting the parameters (the prices) at each iteration (an iteration here being an order line), the script converges towards a suitable approximation of the desired pricing alignment.
In terms of algorithmic complexity, line 36 dominates. However, as the number of compatibilities for any given car model and part type is limited (usually not more than a few dozen), each ‘Auto diff’ iteration is accomplished in what amounts to constant time. This constant time is not very small, like 10 CPU cycles, but it’s not going to be a million CPU cycles either. Approximately, a thousand CPU cycles sounds reasonable for 20 compatible parts.
If we assume a single CPU running at two gigahertz and performing 100 epochs (one epoch being a full descent over the entire observation table), we would anticipate a target execution time of about 10 minutes. Solving a problem with 100,000 variables and 10 million constraints in 10 minutes on a single CPU is quite impressive. In fact, Lokad achieves performance roughly in line with this expectation. However, in practice, for such problems, our bottleneck is more often the I/O throughput rather than the CPU.
Once again, this example showcases the power of employing suitable programming paradigms for supply chain applications. We started with a non-trivial problem, as it wasn’t immediately apparent how to leverage this dataset of mechanical compatibility from a pricing perspective. Despite this, the actual implementation is straightforward.
While this script doesn’t cover all aspects that would be present in a real-world setup, the core logic only requires six lines of code, leaving ample room to accommodate additional complexities that real-world scenarios might introduce.

The alignment algorithm, as presented earlier, prioritizes simplicity and clarity over comprehensiveness. In a real-world setup, additional factors would be expected. I will survey these factors shortly, but let’s start by acknowledging that these factors can be addressed by extending this alignment algorithm.
Selling at a loss is not only unwise but also illegal in many countries, like France, although there are exceptions under special circumstances. To prevent selling at a loss, a constraint can be added to the alignment algorithm that mandates the selling price to exceed the purchase price. However, it’s also useful to run the algorithm without this “no loss” constraint to identify potential sourcing issues. Indeed, if a competitor can afford to sell a part below Stuttgart’s purchase price, Stuttgart needs to address the underlying problem. Most likely, it’s a sourcing or purchasing issue.
Simply lumping together all the part numbers is naive. Customers don’t have the same willingness to pay for all the Original Equipment Manufacturers (OEMs). For example, customers are more likely to value a well-known brand like Bosch compared to a lesser-known Chinese OEM in Europe. To address this concern, Stuttgart, like its peers, categorizes OEMs into a short list of product ranges from the most expensive to the least expensive. We can have, for example, the motorsport range, the household range, the distributor brand range, and the budget range.
The alignment is then constructed to ensure that every part number is aligned within its own product range. Furthermore, the alignment algorithm should mandate prices to be strictly decreasing when going from the motorsport range to the budget range, as any inversion would confuse customers. In theory, if competitors were accurately pricing their own offerings, such inversions would not occur. However, in practice, customers sometimes misprice their own parts, and occasionally they have reasons to set their parts at a different price tag.
There are only a few hundred OEMs, classifying those OEMs into their respective product ranges can be done manually, and possibly with the help of customer surveys if there are ambiguities that cannot be directly resolved by the market experts at Stuttgart.

Despite the adoption of product ranges, many part number prices do not end up being actively driven by the alignment logic. Indeed, only the part numbers that actively contribute to being the best price among a unit of need are effectively adjusted by the gradient descent to create the approximate alignment we’re seeking within the same product range.
Out of two part numbers that have identical mechanical compatibilities, only one of them will have its price adjusted by the alignment solver. The other part number will always get zero gradients, and thus its original price will be left untouched. Thus, in summary, while the system has a whole set of constraints, many variables are not constrained at all. Depending on the granularity of the product ranges and the extent of competitive intelligence, these unconstrained part numbers may represent a sizable fraction of the catalog, possibly half of the part numbers. Although the fraction, once expressed in volume of sales, is much lower.
For these part numbers, Stuttgart requires an alternate pricing strategy. While I do not have a strict algorithmic process to suggest for these unconstrained parts, I would propose two guiding principles.
First, there should be a non-trivial price gap, say 10%, between the most competitive part within the product range and the next part. With some luck, some competitors may not be as adept as Stuttgart at reconstructing the units of need. Thus, those competitors may miss the one price tag that actually drives the alignment, leading them to revise their price upwards, which is desirable for Stuttgart.
Second, there might be some parts with a much higher price tag, say 30% more expensive, as long as those parts don’t end up overlapping with other product ranges. These parts serve as foils for their better-priced counterparts, a strategy technically known as decoy pricing. The decoy is deliberately designed to be a less attractive option than the target option, making the target option appear more valuable and leading the customer to choose it more often. These two principles are sufficient to gently spread the unconstrained prices beyond their competitive thresholds.

Competitive alignment plus a dose of decoy pricing are sufficient to assign a price tag for every part number on display at Stuttgart. However, the resulting gross margin rate is likely to be too low for Stuttgart. Indeed, aligning Stuttgart with all its notable competitors puts a tremendous amount of pressure on its margin.
On one hand, aligning prices is a necessity; otherwise, Stuttgart will be pushed out of the market altogether over time. But on the other hand, Stuttgart can’t bankrupt itself in the process of preserving its market share. It’s crucial to remember that the future gross margin associated with a given pricing strategy can only be estimated or forecasted. There is no exact way to derive the future growth rate from a set of prices, as both customers and competitors adapt.
Assuming we have a reasonably accurate estimate of the gross margin rate that Stuttgart should expect next week, it’s important to point out that the ‘accuracy’ part of this assumption is not as unreasonable as it may sound. Stuttgart, like its competitors, operates under severe constraints. Unless the pricing strategy of Stuttgart is fundamentally modified, the company-wide gross margin will not change much from one week to the next. We can even treat the observed gross margin rate of last week as a reasonable proxy for what Stuttgart should expect next week, naturally assuming that the pricing strategy remains unchanged.
Let’s say that the gross margin rate of Stuttgart is projected to be 13%, but Stuttgart needs a 15% gross margin rate to sustain itself. What should Stuttgart do when facing such a situation? One answer consists of picking a random selection of ‘units of needs’ and raising their prices upward by around 20%. Part types favored by first-time customers, like windshield wipers, should be excluded from this selection. Gaining those first-time customers is expensive and difficult, and Stuttgart should not risk these first-time purchases. Similarly, for very expensive part types, like injectors, customers are likely to shop around a lot more. Thus, Stuttgart should probably not risk appearing uncompetitive on those bigger purchases.
However, barring these two situations, I would argue that randomly selecting ‘units of needs’ and making them uncompetitive through higher prices is a reasonable option. Indeed, Stuttgart needs to raise some of its prices, an unavoidable consequence of seeking a higher growth margin rate. If Stuttgart adopts a discernible pattern while doing so, then online reviews are likely to point out those patterns. For instance, if Stuttgart decides to give up on being competitive on parts from Bosch or decides to give up on being competitive on parts compatible with Peugeot vehicles, there’s a real danger for Stuttgart to become known as the dealer that isn’t a good deal for Bosch or Peugeot vehicles. Randomness makes Stuttgart somewhat inscrutable, which is precisely the intended effect.

Display ranks are another crucial factor in Stuttgart’s online catalog. More specifically, for every ‘unit of need’, Stuttgart needs to rank all the eligible parts. Determining the best way to rank the parts is a pricing-adjacent problem that warrants a lecture of its own. Display ranks, from the perspective presented in this lecture, would be expected to be computed after the resolution of the alignment problem. However, it would also be conceivable to optimize both the price tags and the display ranks simultaneously. This problem would present about 10 million variables instead of the 100,000 variables we’ve dealt with so far. Yet, this doesn’t fundamentally alter the scale of the optimization problem, as we have 10 million constraints to deal with anyway. I won’t be addressing today what sort of criterion could be used to guide this display rank optimization, nor how to leverage gradient descent for discrete optimization. This latter concern is quite interesting but will be addressed in a later lecture.

The relative importance of the ‘unit of need’ is almost entirely defined by the existing vehicle fleets. Stuttgart can’t expect to sell 1 million brake pads for a car model that only has 1,000 vehicles in Europe. It could even be argued that the true consumers of parts are the vehicles themselves rather than their owners. While vehicles don’t pay for their parts (owners do), this analogy helps emphasize the importance of the vehicle fleet.
However, it’s reasonable to expect substantial distortions when it comes to people buying their parts online. After all, purchasing parts is primarily a way to save money compared to buying them indirectly from a repair shop. Therefore, the average vehicle age as observed by Stuttgart is expected to be older than what the general statistics of the automotive market would suggest. Similarly, people driving expensive cars are less likely to attempt to save money by doing their own repairs. Thus, the average vehicle size and class observed by Stuttgart is expected to be lower than what general market statistics would suggest.
These aren’t idle speculations. These distortions are indeed observed for all the major online car parts retailers in Europe. Yet, the alignment algorithm, as presented previously, leverages the sales history of Stuttgart as a proxy of demand. It’s conceivable that these biases could undermine the outcome of the price alignment algorithm. Whether these biases negatively impact the outcome for Stuttgart is fundamentally an empirical problem, as the magnitude of the problem, if any, is highly data-dependent. The experience of Lokad indicates that the alignment algorithm and its variations are quite robust against this class of biases, even when misestimating the weight of a ‘unit of need’ by a factor of two or three. The primary contribution of these weights, price-wise, appears to help the alignment algorithm resolve conflicts when the same part number belongs to two ‘units of need’ that can’t be addressed jointly. In the majority of these situations, one ‘unit of need’ vastly outnumbers the other in terms of volume. Thus, even a sizable misestimation of the respective volumes has little pricing consequence.
Identifying the biggest biases between what the demand should have been for a ‘unit of need’ and what Stuttgart does observe as realized sales can be quite useful. Surprisingly low sales volume for a given ‘unit of need’ tends to indicate mundane problems with the e-commerce platform. Some parts might be mislabeled, some may have incorrect or low-quality pictures, etc. In practice, these biases can be identified by comparing the sales ratios for a given car model of the distinct part types. For example, if Stuttgart doesn’t sell any brake pads for a given car model, while the sales volumes for other part types are consistent with what’s usually observed, it’s unlikely that this car model has an exceptionally low consumption of brake pads. The root cause is almost certainly found elsewhere.

A superior list of mechanical compatibilities is a competitive advantage. Knowing compatibilities that are unknown to your competitors allows you to potentially underprice them without triggering a price war, thus gaining an edge in raising your market share. Conversely, identifying incorrect compatibilities is critical to avoid costly returns from customers.
Indeed, the cost of ordering an incompatible part is modest for a repair shop, as there is likely an established process to send back the unused part to the distribution center. However, the process is much more tedious for regular customers who may not even succeed at properly repackaging the part for its return trip. Thus, every e-commerce company has an incentive to build its own data enrichment layer on top of the third-party data sets that they rent. Most e-commerce players in this vertical have their own data enrichment layer in one form or another.
There are few incentives to share this knowledge with the specialized companies that maintain those data sets in the first place, as this knowledge would mostly benefit the competition. It is difficult to assess the error rate in those data sets, but at Lokad, we estimate that it hovers around a low single-digit percentage on both sides. There are a few percent of false positives, where a compatibility is declared when it doesn’t exist, and there are a few percent of false negatives, where a compatibility exists but is not declared. Considering that the list of mechanical compatibilities includes more than 100 million lines, there are most likely around seven million errors under conservative estimates.
Therefore, it is in Stuttgart’s interest to improve this data set. Customer returns reported as being caused by false positive mechanical compatibility can certainly be leveraged for this purpose. However, this process is slow and costly. Furthermore, as customers are not professional automotive technicians, they might report a part as being incompatible when they have just failed to mount the part. Stuttgart can postpone ruling a part as incompatible until several complaints have been made, but this makes the process even more costly and slower.
Thus, a numerical recipe to improve this compatibility data set would be highly desirable. It is not obvious that it is even possible to improve this data set without leveraging additional information. However, somewhat surprisingly, it turned out that this data set can be improved without any further information. This data set can be used to bootstrap itself into a superior version.
I personally stumbled upon this realization in the first quarter of 2017 as I was conducting a series of deep learning experiments for Lokad. I used a matrix factorization, a well-known technique for collaborative filtering. Collaborative filtering is the central problem when building a recommender system, which consists of identifying the product that a user might like based on the known preferences of this user for a short list of products. Adapting collaborative filtering to mechanical compatibilities is straightforward: replace users by car models and replace products by car parts. Voila, the problem is adapted.
More generally, matrix factorization is applicable for any situation involving a bipartite graph. Matrix factorization is also useful beyond graph analysis. For example, low rank adaptation of large language models (LLMs), a technique that has become hugely popular to fine-tune LLMs, also relies on the matrix factorization trick. Matrix factorization is illustrated on the screen. On the left, we have the compatibility matrix with ones to denote a compatibility between a car and a part, and zeros to denote incompatibility between a car model and a part number. We want to replace this large and very sparse matrix with the product of two smaller dense matrices. Those two matrices are visible on the right. These matrices serve to factorize the large matrix. Effectively, we are plunging every car model and part number into a latent space. The dimension of this latent space is denoted capital L on the screen. This latent space is designed to capture the mechanical compatibilities but with many fewer dimensions compared to the original matrix. By keeping the dimension of this latent space fairly low, we aim to learn the hidden rules that govern these mechanical compatibilities.

While matrix factorization may sound like a grand technical concept, it is not. It is a basic trick of linear algebra. The only deceptive aspect about matrix factorization is that it works so well despite being so simple. On the screen is a complete implementation of this technique in less than 30 lines of code.
From lines one to three, we are reading the flat file that lists the mechanical compatibilities. This file is loaded into a table named M for conciseness, which stands for matrix. This list is effectively a sparse representation of the compatibility matrix. When loading this list, we also create two other tables named car_models and pns. These blocks give us three tables: M, car_models, and pns.
Lines five and six involve randomly shuffling the column that contains the car models. The purpose of shuffling is to create random zeros, or random incompatibilities. Indeed, the compatibility matrix is very sparse. When picking a random car and a random part, we are almost certain that this pair is incompatible. The confidence we have in this random association being zero is actually higher than the confidence we have in the compatibility list in the first place. These random zeros are 99.9% accurate by design due to the sparsity of the matrix, while the known compatibilities are maybe 97% accurate.
Line eight involves creating the latent space with 24 dimensions. While 24 dimensions may seem like a lot for embeddings, it is very small compared to large language models, which have embeddings over a thousand dimensions. Lines nine and ten involve creating the two small matrices, named pnl and car_L, that we will use to factorize the large matrix. These two matrices represent approximately 24 million parameters for pnl and 2.4 million parameters for car_L. This is considered small compared to the large matrix, which has approximately 100 billion values.
Let’s point out that the large matrix is never materialized in this script. It is never explicitly turned into an array; it is always kept as a list of 100 million compatibilities. Turning it into an array would be vastly inefficient in terms of computing resources.
Lines 12 to 15 introduce two helper functions named sigmoid and log_loss. The sigmoid function is used to convert the raw matrix product into probabilities, numbers between 0 and 1. The log_loss function stands for logistic loss. The logistic loss applies the log likelihood, a metric used to assess the correctness of a probabilistic prediction. Here it is used to assess a probabilistic prediction for a binary classification problem. We have already encountered the log likelihood in lecture 5.3, dedicated to the probabilistic forecast of lead times. This is a simpler variation of the same idea. These two functions are marked with the keyword autograd, indicating that they can be automatically differentiated. The small value of one over a million is an epsilon introduced for numerical stability. It has no bearing on the logic otherwise. From lines 17 to 29, we have the matrix factorization itself. Once more, we are using differentiable programming. A few minutes ago, we were using differentiable programming to approximately solve a constraint satisfaction problem. Here, we are using differentiable programming to address a self-supervised learning problem.
In lines 18 and 19, we are declaring the parameters to be learned. These parameters are associated with the two small matrices, pnl and car_L. The keyword ‘auto’ indicates that these parameters are randomly initialized as random deviates from a Gaussian distribution centered on zero, with a standard deviation of 0.1.
Lines 20 and 21 introduce two special parameters that speed up the convergence. These are just 48 numbers in total, a drop in the ocean compared to our small matrices that still have millions of numbers. And yet, I have found that introducing these parameters substantially speeds up the convergence. It’s important to point out that these parameters do not introduce any degree of freedom for the existing model. These parameters only introduce a tiny few extra degrees of freedom in the learning process. The net effect is that they cut by more than half the number of necessary epochs.
In lines 22 to 24, we are loading the embeddings. At line 22, we have the embedding for a single part named px. At line 23, we have the embedding for a single car model named mx. The pair px and mx will be our positive edge, a compatibility deemed as true. At line 24, we have the embedding for another car model named mx2. The pair px and mx2 will be our negative edge, a compatibility deemed as false. Indeed, mx2 has been randomly picked through the shuffle that happens at line six. The three embeddings px, mx, and mx2 all have exactly 24 dimensions, as they belong to the latent space, represented by the table L in this script.
At line 26, we express the probability, as defined by our model, through a dot product of this edge to be positive. We know this edge to be positive, at least that’s what the compatibility dataset tells us. But here we assess what our probabilistic model says about this edge. At line 27, we express the probability, also defined by our probabilistic model, through the dot product of this edge to be negative. We guess this edge to be negative as it’s a random edge. Again, we assess this probability to see what our model says about this edge. At line 29, we return the opposite of the log likelihood associated with this edge. The return value is used as a loss to be minimized by the stochastic gradient descent. Here, it means that we are maximizing the log likelihood, or probabilistic binary classification criteria, between compatible and incompatible pairs.
Afterwards, beyond what is shown in this script, the large matrix can be compared to the dot product of two small matrices. The divergences between the two representations outline both the false positives and the false negatives of the original datasets. The most amazing thing is that the factorized representation of this large matrix ends up being more accurate than the original matrix.
Unfortunately, I cannot present the empirical results associated with these techniques, as the relevant compatibility datasets are all proprietary. However, my findings, validated by a few actors in this market, indicate that these matrix factorization techniques can be used to reduce the number of false positives and false negatives by up to an order of magnitude. In terms of performance, I went from about two weeks of computation to get a satisfying convergence with the deep learning toolkit I was using, CNTK - the deep learning toolkit of Microsoft back in 2017, to about an hour with the present-day runtime offered by Envision. The early deep learning toolkits did offer differentiable programming in a sense; however, those solutions were heavily optimized for large matrix products and large convolutions. More recent toolkits, like Jax by Google, I suspect would yield performance comparable to the performance of Envision.
This raises the question: why aren’t specialized companies that maintain compatibility datasets using matrix factorization already to clean up their datasets? If they had, matrix factorization wouldn’t bring anything new. Matrix factorization as a machine learning technique has been around for almost 20 years. This technique was popularized back in 2006 by Simon Funk. It’s not exactly cutting edge anymore. My answer to this original question is I don’t know. Maybe those specialized companies will start using matrix factorization after watching this lecture, or maybe not.
In any case, this demonstrates that differentiable programming and probabilistic modeling are very versatile paradigms. From afar, lead time forecasting has nothing to do with the assessment of mechanical compatibilities, and yet both can be addressed with the same instrument, namely differentiable programming and probabilistic modeling.

The dataset of mechanical compatibilities is not the only dataset that may prove to be inaccurate. Sometimes, the competitive intelligence tools also bring back bogus data. Even if the web scripting process is fairly reliable when extracting millions of prices from semi-structured web pages, errors may happen. Identifying and addressing these erroneous prices is a challenge of its own. However, this would also deserve a specific lecture, as issues tend to be both specific to the targeted website and the technology used for web scripting.
While web scraping concerns are important, these concerns unfold before the alignment algorithm is run, and thus should be largely decoupled from the alignment itself. Scrapping errors don’t have to be left to chance. There are two ways to play the competitive intelligence game: you can either make your numbers better, more accurate, or you can make the numbers of your competitors worse, less accurate. This is what counter-intelligence is about.
As discussed previously, blocking robots based on their IP address is not going to work. However, there are alternatives. The network transport layer is not even close to being the most interesting layer to play with if we intend to seed some well-targeted confusion. About a decade ago, Lokad conducted a series of counter-intelligence experiments to see if a large e-commerce website, like SugAr, could defend itself against competitors. The results? Yes, it can.
At some point, I was even able to confirm the effectiveness of these counter-intelligence techniques through direct inspection of the data delivered by the otherwise unsuspecting web scraping specialist. The codename for this initiative was Bot Defender. This project has been discontinued, but you can still see a few traces of Bot Defender in our public blog archive.
Instead of trying to deny access to the HTML pages, which is a losing proposition, we decided to selectively interfere with the web scrapers themselves. The Lokad team didn’t know the fine print of the design of these web scrapers. Considering the DHTML structure of a given e-commerce website, it’s not too difficult to make an educated guess about how a company operating the web scrapers would proceed. For example, if every HTML page of the StuttArt website has an overly convenient CSS class named ‘unit price’ that singles out the price of the product in the middle of the page, it’s reasonable to assume that pretty much all robots will be using this highly convenient CSS class to isolate the price within the HTML code. Indeed, unless the StuttArt website offers an even more convenient way to get the prices, like an open API that can be queried freely, this CSS class is the obvious path to extract the prices.
However, as the web scraping logic is obvious, it’s also obvious how to selectively interfere with this logic. For example, StuttArt can decide to cherry-pick a few well-targeted products and ‘poison’ the HTML. In the given example on the screen, visually both HTML pages are going to render for humans as a price tag of 65 Euro and 50 cents. However, the second version of the HTML page is going to be interpreted by robots as 95 Euro instead of 65 Euro. The number ‘9’ is rotated by CSS to appear like a ‘6’. The baseline typical web scraper, which relies on HTML markup, is not going to catch this.

Ten years later, even a sophisticated Large Language Model like GPT-4, which didn’t exist at the time, is still fooled by this simple CSS trick. On the screen, we see that GPT-4 does not extract a price of 65 Euro as it should have been but instead answers 95 Euro. Marginally, there are dozens of ways to craft an HTML code that offers an obvious price tag for a robot that diverges from the one a human being would read on the website. Rotating a ‘9’ into a ‘6’ is just one of the simplest tricks within a vast array of similar tricks.
A counter to this technique would consist of rendering the page, creating the complete bitmap, and then applying Optical Character Recognition (OCR) to this bitmap. However, it’s quite costly. Competitive intelligence companies must recheck tens of millions of web pages daily. As a rule of thumb, running a web page rendering process followed by OCR increases the processing cost by at least a factor of 100, and more likely by a factor of 1000.
As a point of reference, as of May 2023, Microsoft Azure is charging one dollar for one thousand OCR operations. Considering that there are 10 million plus pages to be monitored daily by the competitive intelligence specialists in Europe, that’s a $10,000 budget per day in OCR alone. And Microsoft Azure, by the way, is quite competitive on this front.
Considering other costs like bandwidth for those precious residential IP addresses, it’s most likely to be in the 5 million euro annual budget range in terms of computing resources alone that is being discussed here if we go down this path. A multi-million annual budget is within the range of the possible, but the margins of the web scraper companies are thin and they won’t go down this path. If through vastly cheaper means they can achieve 99% accurate competitive intelligence, that is enough to keep their clients satisfied.
Back to StuttArt, it would be unwise to use this counterintelligence technique to poison all the prices, as it’s going to escalate the arms race with the web scrapers. Instead, StuttArt should wisely choose the one percent of references that will have a maximal impact in terms of competition. Most likely, web scrapers aren’t even going to notice the problem. Even if web scrapers do notice the countermeasures, as long as it’s perceived as a low-intensity problem, they won’t be acting on it. Indeed, web scraping comes with all sorts of low-intensity issues: the website you want to analyze can be super slow, it can be down, or the webpage of interest can have glitches. A conditional promotion might be present, making the price unclear for the part of interest.
From StuttArt’s perspective, we are left with choosing the one percent of part numbers which are of maximal interest in terms of competitive intelligence. Those parts would typically be the ones that StuttArt would like to discount the most, but without triggering a price war. There are several ways to go about this. One type of high-interest parts are cheap consumables, like windshield wipers. A customer who wants to try StuttArt for his first purchase is unlikely to start with a 600 Euro injector. A first-time customer is much more likely to start with a 20 Euro windshield wiper as a test run. More generally, first-time customers behave quite differently from repeat customers. Thus, the one percent of parts that StuttArt should probably want to make especially attractive, without triggering a price war, are the parts that are most likely to be purchased by first-time customers.

Avoiding a price war and market share erosion are both severely negative outcomes for StuttArt, so it takes some special circumstances to diverge from the alignment principle. We have already seen one of these circumstances, which was the need to control the gross margin. However, it’s not the only one. Overstocks and stockouts are two other prime candidates to consider for adjusting prices. Overstocks are best addressed proactively. It would be better for StuttArt to avoid overstocks entirely, but mistakes happen as well as market swings, and despite careful inventory replenishment policies, StuttArt will routinely face localized overstocks. Pricing is a valuable mechanism to mitigate these issues. StuttArt is still better off selling the overstock parts with a substantial discount rather than not selling them at all, thus overstocks must be factored into the pricing strategy.
Let’s narrow the scope of overstocks to the sole parts that are very likely to turn into inventory write-off. In this context, overstocks can be addressed with a cost alignment override that lowers the price tag to near-zero gross margin, and possibly a little bit below depending on the regulations and the magnitude of the overstock.
Conversely, stockouts, or rather near-stockouts, should have their price tags revised upwards. For instance, if StuttArt has only five units left in stock for a part that typically sells one unit per day, and the next replenishment won’t arrive before 15 days from now, then this part is almost certainly going to face a stockout. There’s no point rushing into the stockout. StuttArt could raise its price for this part. As long as the decrease in demand is sufficiently small for StuttArt to avoid a stockout, it won’t matter.
Competitive intelligence tools are increasingly capable of monitoring not only the prices but also the shipping delays announced for the parts on display on a competitor’s website. This offers the possibility for StuttArt to monitor not only its own stockouts but also monitor the stockouts as they unfold for competitors. A frequent root cause behind a retailer’s stockout is a supplier’s stockout. If the OEM itself is out of stock, then StuttArt, along with all its competitors, is likely to end up out of stock as well. As part of the pricing alignment algorithm, it is reasonable to remove those parts from the alignment that are either out of stock from the suppliers or that are out of stock from the competitor’s website. Competitors’ out of stock situations can be monitored through shipping delays when those shipping delays reflect unusual conditions. Also, if an Original Equipment Manufacturer (OEM) starts to announce unusual delays for parts, it might be time to increase the price points for those parts. This is because it indicates that everyone in the market will most likely be struggling to acquire more car parts from this particular OEM.
At this point, it should become quite evident that pricing optimization and inventory optimization are highly coupled problems, and thus, these two problems must be resolved jointly in practice. Indeed, within a given unit of need, the part that benefits from both the lowest price and the highest display rank within its product range is going to absorb the bulk of the sales. Pricing directs the demand across numerous alternatives within StuttArt’s offering. It does not make sense to have an inventory team attempting to forecast the prices as generated by the pricing team. Instead, there should be a unified supply chain function that addresses jointly the two concerns.

Shipping conditions are an integral part of the service. When it comes to automotive parts, not only do customers have high expectations that StuttArt will fulfill its promises, but they might even be willing to pay extra if it expedited the process. Several major e-commerce companies selling car parts in Europe are already offering distinct prices depending on the lead time. These distinct prices don’t merely reflect distinct shipment options but possibly distinct sourcing options as well. If the customer is willing to wait one or two weeks, then StuttArt gains extra sourcing options, and StuttArt may pass some of the savings directly to the customers. For example, a part may only be acquired by StuttArt after it was ordered by the customer, hence removing the carrying cost and the inventory risk entirely.
Shipping conditions complicate the competitive intelligence. First, competitive intelligence tools need to retrieve information on delays, not just prices. Many competitive intelligence specialists are already doing this, and StuttArt needs to follow suit. Second, StuttArt needs to adjust its pricing alignment algorithm to reflect the varying shipping conditions. Differentiable programming can be put to the task of providing an estimate of the value, expressed in euros, brought by saving one day of time. This value is expected to be dependent on the car model, the part type, and the number of days for the shipment. For instance, going from a three-day lead time to a two-day lead time is a lot more valuable for the customer than going from a 21-day lead time to a 20-day lead time.

In conclusion, an extensive pricing strategy has been proposed today for StuttArt, a supply chain persona dedicated to the online automotive aftermarket. We have seen that pricing is not amenable to any kind of local optimization strategy. The pricing problem is indeed non-local due to the mechanical compatibility that propagates the impact of a price tag for any given part across numerous units of needs. This led us to a perspective where pricing is approached as an alignment at the level of the unit of need. Two sub-problems were addressed through differentiable programming. First, we had the resolution of an approximate constraint satisfaction problem for the competitive alignment itself. Second, we had the problem of the self-improvement of the mechanical compatibility datasets to improve the quality of the alignment, but also to improve the quality of the customer experience. We can add these two problems to our growing list of supply chain problems that benefit from a straightforward solution once approached through differentiable programming.
More generally, if there is one takeaway from this lecture, it is not that the automotive aftermarket is an outlier when it comes to pricing strategies. On the contrary, the takeaway is that we should always expect to face numerous specificities, no matter the vertical of interest. There would have been just as many specificities if we had looked at any other supply chain persona instead of focusing on StuttArt, as we did today. Thus, it is pointless to look for any definitive answer. Any closed-form solution is guaranteed to fail to address the endless flow of variations that will arise over time from a real-world supply chain. Instead, we need concepts, methods, and instruments that not only let us address the present state of the supply chain but are also amenable to programmatic modification. Programmability is essential to future-proof the numerical recipes for pricing.

Before we move on to the questions, I’d like to announce that the next lecture will be on the first week of July. It will be a Wednesday as usual, at the same time of the day - 3 P.M, Paris time. I will be revisiting chapter one with a closer look at what economics, history, and system theory tell us about supply chain and supply chain planning.
Now let’s look at the questions.
Question: Do you intend to deliver a lecture on visualizing the total cost of ownership for one supply chain? In other words, a TCO analysis of the entire supply chain using data analytics and overall cost optimization?
Yes, this is part of the journey of this series of lectures. Elements of this have been discussed in quite a few lectures already. But the key thing is, it’s not really a visual problem. The point of total cost of ownership is not a data visualization problem; it’s a problem of mindset. Most supply chain practices are extremely dismissive about the financial perspective. They are chasing service levels of error, not dollars or Euros of error. Most, unfortunately, are chasing these percentages. Thus, there is a need for a shift of mindset.
The second thing is that there are elements discussed in the lecture that was part of the first chapter - the product-oriented, as in software product-oriented delivery for the supply chain. We have to think not only about the first circle of economic drivers but also what I call the second circle of economic drivers. These are elusive forces, for example, if you discount the price of a product by one Euro by creating a promotion, a naive analysis might suggest that it cost me one Euro of margin just because I’ve made this one Euro discount. But the reality is that by doing that, you are creating an expectation among your customer base to expect this one Euro discount in the future again. And thus, this comes with a cost. It’s a second-order cost, but it’s very real. All these second-circle economic drivers are important drivers that do not appear in your ledger or your books. Yes, I will be proceeding with more elements that describe these costs. However, it’s mostly not an analytical problem in terms of visualization or charting; it’s a matter of mindset. We must come to terms with the idea that these things have to be quantified, even if they are incredibly difficult to quantify.
When we start discussing the total cost of ownership, we also have to discuss how many people I need to operate on this supply chain solution. That’s one of the reasons why, in this series of lectures, I say we need to have programmatic solutions. We can’t have an army of clerks tweaking spreadsheets or tables and doing things that are incredibly cost-inefficient, such as dealing with alerts of exceptions in supply chain software. Alerts and exceptions consist of treating your entire workforce in the company as human co-processors for the system. This is incredibly costly.
The total cost of ownership analysis is mostly a problem of mindset, of having the right perspective. In the next lecture, I will also revisit more angles, especially what economics tells us about the supply chain. It’s very interesting because we have to think about what the total cost of ownership really means for a supply chain solution, especially if we start thinking about the value it brings to the company.
Question: For technically compatible references to a unit of need, there are perceived differences in the quality, activeness, silver, gold, etc. How do you take this into account into a competitor price matching?
That’s completely correct. That’s why there is a need to introduce product ranges. This level of attractiveness can usually be framed into about half a dozen classes that represent quality standards for parts. For example, you have the motorsport range, which includes the most luxurious parts with excellent mechanical compatibility. These parts also look good, and the packaging itself is of high quality.
My experience with this market is that, although there are infinite variations in how you can make the quality of a part slightly higher or better, the market has pretty much converged towards about half a dozen product ranges that go from very expensive to not so expensive. When we are grouping the parts of StuttArt, we need to group those parts within product ranges. The same is true for the parts of the competitors, which means we need to know what is the sort of quality range of a part, even if the part is not sold by StuttArt.
StuttArt needs to have an awareness of all the parts of the market. This is not as difficult as it may seem because most manufacturers provide information about the expected quality of their parts. These things are quite codified by the original equipment manufacturers (OEMs) themselves. We benefit from the fact that the automotive market is an incredibly established, super mature market that has been around for more than a century. The companies that sell these compatibility datasets, datasets for cars and parts compatibilities, also provide a wealth of attributes for parts and car models. We’re talking about hundreds of attributes. These datasets are extensive and rich. Originally, these datasets were used by people in repair centers to figure out how to conduct repairs. They even come with PDF attachments and technical documentation. It’s very rich; you have dozens of gigabytes of data, including images and photos. I was barely scratching the surface in terms of the market value of these datasets.
Question: How do varying regulations across regions impact pricing optimization for automotive companies? For example, you mentioned Peugeot, a French company. How would your approach for Peugeot differ from a similar company in Scandinavia or Asia?
Scandinavia is pretty much the same automotive market. They have a few different brands, but it’s too small to sustain its own automotive industry. As far as the automotive industry is concerned, Scandinavia is just like the rest of the 350 million Europeans. However, Asia is really different. India and China are markets of their own.
With regard to pricing optimization, regulations did not so much prevent, but rather delay the existence of online car part dealers. For example, in Europe 20 years ago, there was a legal battle. Pioneers like StuttArt, who were the first companies to sell car parts online, faced legal contention. They were selling car parts and stating on their website that these were identical to the ones sold by the original car manufacturers.
Companies like StuttArt were saying, “I’m not selling you any car part, I’m selling you the very same car part that the car manufacturer would use.” They were able to make this claim because they were buying the exact same part from the same factory. If a part comes from, let’s say, Valeo and is mounted on a Peugeot car, there’s a known association. What was ruled about two decades ago, several courts in Europe ruled that it was legal for a website to claim to sell the exact same part as those that qualify for original parts of a car. This regulatory uncertainty delayed the rise of spare car parts sold online, probably by about five years. Pioneers were fighting in courts against car manufacturers for the right to sell car parts online while claiming that they were original parts for the car. Once it was cleared up, they could do that as long as they were honest and were really buying the exact same car part from Valeo or Bosch, exactly as the part that is mounted on the car.
However, there are still limitations. For instance, there are still parts that characterize the visual appearance of the car, and only the car manufacturer can sell these as original parts. For example, the hood of the car. These regulations do have an impact in terms of restricting the scope of parts that can be freely sold online while claiming that the part is exactly the same as that from the original manufacturer. We are talking about parts that have implications not only in terms of mechanical compatibility but also safety. Some of these parts are safety critical.
In Asia, one problem that I haven’t discussed here is counterfeits. Dealing with counterfeits is very different in Europe compared to Asia. Counterfeits do exist in Europe, but the market is mature and catalyzed. OEMs and car manufacturers know each other very well. Although counterfeits do exist, it’s a very minimal problem. In markets like Asia, specifically India and China, there are still quite a few problems with counterfeits. It’s not really a problem of regulation, as counterfeits are just as illegal in China as they are in Europe. The problem is enforcement, with the degree of enforcement being much lower in Asia than in Europe.
Question: Are we trying to optimize a price overall or in relation to the competitors?
The optimization function is conceptually for every unit of need - a unit of need being a car model and a part type. For every unit of need, you have a price difference in euros between the price point of StuttArt, which is the best offering of StuttArt, and the price point of the competitor. You take the absolute difference of these two prices and sum them; this is your function. We are not going to naively use this sum of price differences; we are going to add a weight that reflects the annual sales volume of every unit of need.
Therefore, the optimization function for your constraint satisfaction problem is a sum of absolute differences between the best price offered by StuttArt for the unit of need and the best price offered by the competition. You add a weighting factor that reflects the annual importance, also weighted in Euros, for this unit of need. You are trying your best to mirror the state of the European market.
The reason you want to weight against the importance of the unit of need as opposed to the unit of need of StuttArt is that if StuttArt is so uncompetitive that it doesn’t sell anything from the unit of need, you can have a problem where it’s not competitive. Therefore, this unit is disregarded in terms of alignment, leading to zero sales. Then you have a vicious circle where it’s not competitive, thus it doesn’t sell anything, and thus the unit of need itself is discounted as negligible.
Question: Do you see unexpected consequences arising if a differentiable modeling machine learning perspective approach becomes the industry standard, with the risk of models competing with other very similar models?
This question is difficult because, by design, if it’s an unexpected consequence, then nobody expected it, not even me. It’s very difficult to foresee what sort of consequences might be unexpected.
However, more seriously, this industry has been driven by algorithmic techniques for a decade. It’s a refinement in terms of precision of intent. You want a numerical method that is more closely aligned with your intent. But fundamentally, it isn’t as if we are starting from scratch where right now it’s done manually and in ten years from now, it will be done automatically with numerical recipes. It is already done by numerical recipes. When you have 100,000 prices to maintain and refresh every day, you need to have some form of automation.
Perhaps your automation is a gigantic Excel spreadsheet where you’re performing all sorts of black magic, but it is still very much an algorithmic process. People do not manually adjust prices except for a few parts on rare occasions. Mostly, it is already an algorithmic process, and we already have numerous unintended consequences. For example, during the lockdowns in Europe, people were spending more time at home, shopping online. This might seem counterintuitive, but they were still using their cars quite a lot, and therefore, shopping more. However, many companies selling car parts online became less active in terms of promotions because organizing them became more complicated as everyone was working from home.
Consequently, for a couple of months during the 2020 lockdowns, there was much less algorithmic noise generated by promotions. The algorithmic responses were much more straightforward from everyone. There were days when you could see much more sharply the kind of algorithmic responses that were triggered on a daily refresh basis.
This is a fairly mature model in a well-established industry, as everything is now conducted via electronic trading. As for unintended or unexpected consequences, those are harder to predict.
Let me offer a closing thought on a potential area of surprise. Many expect electric vehicles to simplify everything because they have fewer parts compared to internal combustion engines. However, from the perspective of a company like StuttArt, for the next 10 years, electric vehicles will mean a lot more parts on the market.
Until, and if, electric vehicles become dominant, we will still have all the older vehicles with combustion engines. These vehicles will last for around 20 years. Remember that StuttArt, as a company, deals with vehicles that are not exactly brand new. Many of these vehicles are of good quality and will still be around 20 years from now. But meanwhile, we’ll have numerous additional electric vehicles coming onto the market with plenty of different parts. This could cause the number of different parts to rise steadily, creating even more challenges and complications.
I believe this brings us to the end of today’s lecture. If there are no more questions, I look forward to seeing you for the next lecture that will be on the first week of July, Wednesday at 3 p.m. Paris time, as usual. Thank you very much, and see you then.