00:00 Introduction
02:31 Failure root causes in the wild
07:20 Deliverable: a numerical recipe 1/2
09:31 Deliverable: a numerical recipe 2/2
13:01 The story so far
14:57 Getting things done today
15:59 Timeline of the initiative
21:48 Scope: applicative landscape 1/2
24:24 Scope: applicative landscape 2/2
27:12 Scope: system effects 1/2
29:21 Scope: system effects 2/2
32:12 Roles: 1/2
37:31 Roles: 2/2
41:50 Data pipeline - How
44:13 A word on transactional systems
49:13 A word on data lake
52:59 A word on analytical systems
57:56 Data health: low-level
01:02:23 Data health: high-level
01:06:24 Data inspectors
01:08:53 Conclusion
01:10:32 Upcoming lecture and audience questions
Description
Conducting a successful predictive optimization of a supply chain is a mix of soft and hard problems Unfortunately, it is not possible to take those aspects apart. The soft and hard facets are deeply entangled. Usually, this entanglement collides frontally with the division of work as defined by the organigram of the company. We observe that, when supply chain initiatives fail, the root causes of the failure are usually mistakes made at the earliest stages of the project. Furthermore, early mistakes tend to shape the entire initiative, making them near impossible to fix ex post. We present our key findings to avoid those mistakes.
Full transcript

Welcome to this series of supply chain lectures. I’m Joannes Vermorel, and today I will be presenting “Getting Started with a Quantitative Supply Chain Initiative.” The vast majority of data-crunching supply chain initiatives are failing. Since 1990, most companies operating large supply chains have been launching major predictive optimization initiatives every three to five years with little or no results. Nowadays, most teams in supply chains or data science, starting yet another round of predictive optimization—typically framed as a forecasting project or an inventory optimization project—don’t even realize that their company has already been there, done that, and failed possibly half a dozen times already.
Going for yet another round is sometimes driven by the belief that this time it will be different, but frequently, teams are not even aware of the many failed attempts that happened before. Anecdotal evidence for this state of affairs is that Microsoft Excel remains the number one tool to drive supply chain decisions, while those initiatives were supposed to replace spreadsheets with better tools. Yet, nowadays, there are still very few supply chains that can operate without spreadsheets.
The goal of this lecture is to understand how to give a chance of success to a supply chain initiative that intends to deliver any kind of predictive optimization. We will review a series of critical ingredients—those ingredients are simple and yet they come very frequently as counterintuitive for most organizations. Conversely, we will review a series of anti-patterns which almost guarantee the failure of such an initiative.
Today, my focus is on the tactical execution of the very start of a supply chain initiative with a “get things done” mindset. I will not be discussing the grand strategic implications for the company. Strategy is very important, but I will be discussing this matter in a later lecture.

Most supply chain initiatives do fail, and the problem is barely ever mentioned publicly. Academia publishes tens of thousands of papers per year boasting all sorts of supply chain innovations, including frameworks, algorithms, and models. Frequently, the papers even claim that the innovation has been put to production somewhere. And yet, my own casual observation of the supply chain world is that those innovations are nowhere to be seen. Similarly, software vendors have been promising superior replacements for spreadsheets for the last three decades, and again, my casual observation indicates that spreadsheets remain ubiquitous.
We are revisiting a point that was already touched in the second chapter of this series of supply chain lectures. Simply put, people have zero incentives to advertise failure, and thus they don’t. Moreover, as companies operating supply chains tend to be large, the problem is typically compounded by the natural loss of institutional memory as employees keep rotating from one position to the next. That’s why neither academia nor vendors acknowledge this rather dismal situation.
I propose to start with a short survey of the most frequent root causes for failure from a tactical execution perspective. Indeed, these root causes are typically found at the earliest stage of the initiative.
The first cause for failure is an attempt to solve the wrong problems—problems that are non-existent, inconsequential, or reflect some sort of misunderstanding about the supply chain itself. Optimizing percentages of forecasting accuracy is probably the archetype of such an incorrect problem. Reducing the percentage of forecasting error does not directly translate into extra euros or dollars of return for the company. The same situation occurs when a company is chasing specific service levels for its inventory. It’s very rare to have any euros or dollars of return to show for it.
The second root cause of failure is the use of ill-fitting software technology and software design. For example, ERP vendors invariably try to use a transactional database to support data-crunching initiatives because it is what the ERP is built on. Conversely, data science teams invariably try to use the bleeding-edge open-source machine learning toolkit of the day because it is a cool thing to do. Unfortunately, ill-fitting pieces of technology typically generate immense friction and a lot of accidental complexity.
The third root cause of failure is an incorrect division of labor and organization. In a misguided attempt to allocate specialists at every stage of the process, companies tend to fragment the initiative over too many people. For example, data preparation is very frequently done by people who are not in charge of forecasting. As a result, garbage-in-garbage-out situations are all over the place. Marginally diluting the responsibility of the final supply chain decisions is a recipe for failure.
One item that I have not listed in this short list as a root cause is bad data. Data is very frequently blamed for the failures of supply chain initiatives, which is all too convenient, as data cannot exactly respond to those accusations. However, data is usually not at fault, at least not in the sense of struggling with bad data. The supply chain of large companies went digital decades ago. Every item that is purchased, transported, transformed, produced, or sold has electronic records. Those records may not be perfect, but they are usually very accurate. If people fail at properly dealing with the data, it is not really the transaction they are that is to blame.

For a quantitative initiative to succeed, we need to fight the right battle. What is it that we are trying to deliver in the first place? One of the key deliverables for a quantitative supply chain is a core numerical recipe that computes the end-game supply chain decisions. This aspect was already discussed in Lecture 1.3 in the very first chapter, “Product-Oriented Delivery for Supply Chain.” Let’s revisit the two most critical properties of this deliverable.
First, the output must be a decision. For example, deciding how many units to reorder today for a given SKU is a decision. On the contrary, forecasting how many units will be requested today for a given SKU is a numerical artifact. In order to generate a decision that is the end result, many intermediate results are needed, that is, many numerical artifacts. However, we must not confuse the means with the end.
The second property for this deliverable is that the output, which is a decision, must be fully automated as a result of a purely automated software process. The numerical recipe itself, the core numerical recipe, must not involve any manual operation. Naturally, the design of the numerical recipe itself is likely to be heavily dependent on a very human expert in science. However, the execution should not be dependent on direct human intervention.
Having a numerical recipe as a deliverable is essential in order to make the supply chain initiative a capitalistic endeavor. The numerical recipe becomes a productive asset that generates returns. The recipe must be maintained, but this requires one or two orders of magnitude fewer people compared to approaches that keep humans in the loop at the micro-decision level.

However, many supply chain initiatives fail because they do not correctly frame supply chain decisions as the deliverable of the initiative. Instead, those initiatives focus on delivering numerical artifacts. Numerical artifacts are intended to be ingredients to get to the final resolution of the problem, typically supporting the decisions themselves. The most common artifacts encountered in supply chain are forecasts, safety stocks, EOQs, KPIs. While those numbers can be of interest, they aren’t real. Those numbers do not have an immediate tangible physical counterpart in the supply chain, and they reflect arbitrary modeling perspectives on the supply chain.
Focusing on the numerical artifacts leads to the failure of the initiative because those numbers are missing one critical ingredient: direct real-world feedback. When the decision is wrong, the bad consequences can be traced back to the decision. However, the situation is much more ambiguous as far as numerical artifacts are concerned. Indeed, the responsibility is diluted all over the place, as there are many artifacts that contribute to every single decision. The problem is even worse when there is human intervention in the middle.
This lack of feedback proves deadly for numerical artifacts. Modern supply chains are complex. Pick any arbitrary formula to compute a safety stock, an economic order quantity, or a KPI; there are overwhelming odds that this formula is wrong in all sorts of ways. The problem of the correctness of the formula isn’t a mathematical problem; it is a business problem. It’s about answering the question, “Does this calculation truly reflect the strategic intent that I have for my business?” The answer varies from one company to the next and even varies from one year to the next as companies evolve over time.
As numerical artifacts lack direct real-world feedback, they lack the very mechanism by which it is possible to iterate from a naive, simplistic, and most likely widely incorrect initial implementation toward an approximately correct version of the formula that could be deemed as production-grade. Yet, numerical artifacts are very tempting because they give the illusion of getting closer to the solution. They give an illusion of being rational, scientific, even undertaking. We have numbers, formulas, algorithms, models. It is even possible to do benchmarks and compare those numbers with equally made-up numbers. Improving against a made-up benchmark gives an illusion of progress as well, and it is very comforting. But at the end of the day, it remains an illusion, a matter of modeling perspective.
Companies do not make profits by paying people to look at KPIs or do benchmarks. They make profits by taking one decision after another and, hopefully, getting better at taking the next decision every single time.

This lecture is a part of a series of supply chain lectures. I’m trying to keep these lectures somewhat independent, but we have reached a point where it makes more sense to watch these lectures in sequence. This lecture is the very first lecture of the seventh chapter, which is dedicated to the execution of supply chain initiatives. By supply chain initiatives, I mean quantitative supply chain initiatives – initiatives that intend to deliver something in the order of predictive optimization for the company.
The very first chapter was dedicated to my views about supply chain both as a field of study and as a practice. In the second chapter, I presented a series of methodologies essential to supply chain, as naive methodologies are defeated due to the adversary nature of many supply chain situations. In the third chapter, I presented a series of supply chain personae with a pure focus on the problems; in other words, what is it that we are trying to solve?
In the fourth chapter, I presented a series of fields which, while they are not supply chain per se, I believe are essential to a modern practice of supply chain. In the fifth and sixth chapters, I presented the smart bits of a numerical recipe intended to drive supply chain decisions, namely predictive optimization (the generalized perspective of forecasting) and decision making (essentially mathematical optimization applied to supply chain problems). In this seventh chapter, we discuss how to put those elements together in an actual supply chain initiative that intends to bring these methods and technologies into production.

Today, we will review what is considered as the correct practice to conduct a supply chain initiative. This includes framing the initiative with the proper deliverable, which we just discussed, but also with the proper timeline, the proper scope, and the proper roles. These elements represent the first part of today’s lecture.
The second part of the lecture will be dedicated to the data pipeline, a critical ingredient for the success of such a data-driven or data-dependent initiative. While the data pipeline is a fairly technical topic, it requires a proper division of labor and organization between IT and supply chain. In particular, we will see that quality controls should be mostly in the hands of supply chain, with the design of data health reports and data inspectors.

The onboarding is the first phase of the initiative, where the core numerical recipe, the one that generates the decision along with only supporting elements, is crafted. The onboarding ends with a progressive rollout into production, and during this rollout, the earlier processes get gradually automated away by the numerical recipe itself.
When considering the appropriate timeline for the first quantitative supply chain initiative in a company, one might think that it depends on the company’s size, complexity, the type of supply chain decisions, and the overall context. While it is true to a limited extent, the experience that Lokad has collected over a decade and dozens of such initiatives indicate that six months is almost invariably the appropriate timeline. Surprisingly, this six-month timeline has little to do with the technology or even the specifics of the supply chain; it has a lot more to do with the people and the organizations themselves and the time it takes for them to get comfortable with what is typically perceived as a very different way of conducting supply chain.
The first two months are dedicated to the setup of the data pipeline. We will revisit this point in a few minutes, but this delay of two months is caused by two factors. First, we need to make the data pipeline reliable and eliminate infrequent issues that may take weeks to manifest. The second factor is that we need to figure out the semantics of the data, which is to understand what the data mean from a supply chain perspective.
Months three and four are dedicated to rapid iteration over the numerical recipe itself, which will drive the supply chain decisions. These iterations are needed because generating actual end-game decisions is usually the only way to assess whether there is something wrong or not with the underlying recipe or all the assumptions built into the recipe. These two months are also typically the time it takes for supply chain practitioners to get used to the very quantitative, financial perspective that drives these software-driven decisions.
Finally, the last two months are dedicated to the stabilization of the numerical recipe after what is usually a relatively intense period of fast iteration. This period is also the opportunity for the recipe to run in a production-like setup, but not yet driving the production. This phase is important for the supply chain teams to gain trust in this emergent solution.
While it could be desirable to compress this timeline further, it turns out that it is typically very difficult. The setup of the data pipeline can be accelerated to some extent if the proper IT infrastructure is already in place, but gaining familiarity with data takes time to understand what the data mean from a supply chain perspective. In the second phase, if the iteration over the numerical recipe converges very swiftly, then the supply chain teams are likely to start exploring the nuances of the numerical recipe, which will also extend the delay. Finally, the last two months are typically what it takes to see the seasonality unfold and gain trust in the software driving important supply chain decisions in production.
All in all, it takes about six months, and while it would be desirable to compress it further, it is challenging to do so. However, six months is already a sizable timeframe. If from day one, the onboarding period, where the numerical recipe is not yet driving the supply chain decisions, is expected to take more than six months, then the initiative is already at risk. If the extra delay is associated with data extraction and the setup of the data pipeline, then there is an IT problem. If the extra delay is associated with the design or configuration of the solution, possibly brought by a third-party vendor, then there is a problem with the technology itself. Finally, if after two months of stabilized production-like run, the production rollout does not happen, then there is typically a problem with the management of the initiative.

When trying to introduce a novelty, a new process, or a new technology into an organization, common wisdom suggests starting small, ensuring it works, and building upon early success to gradually expand. Unfortunately, supply chain isn’t kind to common wisdom, and this perspective comes with a specific twist concerning supply chain scoping. In terms of scoping, there are two main driving forces that largely define what is and what is not an eligible scope as far as a supply chain initiative is concerned.
The applicative landscape is the first force that impacts scoping. A supply chain as a whole cannot be observed directly; it can only be observed indirectly through the lenses of enterprise software. The data will be obtained through these pieces of software. The complexity of the initiative greatly depends on the number and diversity of these software pieces. Each app is its own data source, and extracting and analyzing the data from any given business app tends to be a significant undertaking. Dealing with more apps usually means dealing with multiple database technologies, inconsistent terminologies, inconsistent concepts, and vastly complicating the situation.
Thus, when establishing the scope, we must acknowledge that the eligible frontiers or boundaries are usually defined by the business apps themselves and their database structure. In this context, starting small must be understood as keeping the initial data integration footprint as small as possible while preserving the integrity of the supply chain initiative as a whole. It is better to go deep rather than wide in terms of app integration. Once you have the IT system in place to get some records from a table in a given app, it is usually straightforward to get all the records from this table and all the records from another table in the same app.

One common scoping mistake consists of sampling. Sampling is usually achieved through picking a short list of product categories, sites, or suppliers. Sampling is well-meaning, but it does not follow the boundaries as defined by the applicative landscape. To implement sampling, filters have to be applied during the data extraction, and this process creates a series of issues that are likely to endanger the supply chain initiative.
First, a filtered data extraction from a piece of enterprise software requires more effort from the IT team as opposed to an unfiltered extraction. Filters have to be engineered in the first place, and the filtering process itself is error-prone. Debugging incorrect filters is invariably tedious because it requires numerous exchanges with the IT teams, which will slow down the initiative and, in turn, endanger it.
Second, letting the initiative perform its onboarding on a data sample is a recipe for massive software performance issues as the initiative expands later toward the full scope. Poor scalability, or an inability to process a large amount of data while keeping computing costs under control, is a very frequent defect in software. By letting the initiative operate over a sample, scalability problems are masked but will come back with a vengeance at a later stage.
Operating over a data sample makes statistics more difficult, not easier. Indeed, having access to more data is probably the easiest way to improve the accuracy and stability of almost all machine learning algorithms. Sampling the data goes against this insight. Thus, when using a small data sample, the initiative may fail due to erratic numerical behaviors observed over the sample. These behaviors would have been largely mitigated if the entire data set had been used instead.

System effects are the second force that impacts scoping. A supply chain is a system, and all its parts are coupled to some extent. The challenge with systems, any system, is that attempts at improving a piece of the system tend to displace problems rather than fixing them. For example, let’s consider an inventory allocation problem for a retail network with one distribution center and many stores. If we pick a single store as the initial scope for our inventory allocation problem, it is trivial to ensure that this store will get a very high quality of service from the distribution center by reserving inventory for it ahead of time. By doing that, we can ensure that the distribution center will never run out of stock while serving this one store. However, this reservation of stock would be done at the expense of the quality of service for the other stores in the network.
Thus, when considering a scope for a supply chain initiative, we must consider the system effects. The scope should be designed in a way that largely prevents performing a local optimization at the expense of the elements that are outside the scope. This part of the scoping exercise is difficult because all scopes are leaky to some extent. For example, all parts of the supply chain ultimately compete for the same amount of cash available at the company level. Every dollar allocated somewhere is a dollar that won’t be available for other purposes. Nevertheless, certain scopes are much more easily gamed than others. It is important to pick a scope that tends to mitigate system effects rather than magnify them.

Thinking about the scoping of a supply chain initiative in terms of system effects might feel odd for many supply chain practitioners. When it comes to scoping, most companies are inclined to project their internal organization onto the scoping exercise. Thus, the boundaries chosen for the scope invariably tend to mimic the boundaries of the division of labor in place within the company. This pattern is known as Conway’s Law. Proposed by Melvin Conway half a century ago for communication systems, the law has since been found to have much broader applicability, including prime relevance for supply chain management.
The boundaries and silos that dominate present-day supply chains are driven by divisions of labor that are the consequence of fairly manual processes in place to drive supply chain decisions. For example, if a company assesses that a supply and demand planner cannot manage more than 1,000 SKUs, and the company has 50,000 SKUs to manage overall, the company will require 50 supply and demand planners to do so. Yet, splitting the optimization of the supply chain across 50 pairs of hands is guaranteed to introduce many inefficiencies at the company level.
On the contrary, an initiative that automates these decisions does not need to cater to those boundaries that only reflect an obsolete or soon-to-be obsolete division of labor. A numerical recipe can optimize those 50,000 SKUs at once and eliminate the inefficiencies that result from having dozens of silos pitted against each other. Thus, it is only natural for an initiative that intends to vastly automate these decisions to overlap with many pre-existing boundaries in the company. The company, or actually the management of the company, must resist the urge to mimic the existing organizational boundaries, especially at the scoping level, as it tends to set the tone for what follows.

Supply chains are complex in terms of hardware, software, and people. While it is unfortunate, starting a quantitative supply chain initiative further increases the complexity of the supply chain, at least initially. In the long term, it can actually substantially decrease the complexity of the supply chain, but we’ll get to that probably in a later lecture. Furthermore, the more people involved in the initiative, the greater the complexity of the initiative itself. If this extra complexity is not immediately put under control, then the odds are high that the initiative will collapse under its own complexity.
Thus, when thinking about the roles of the initiative, that is, who is going to do what, we need to think about the smallest possible set of roles that makes the initiative viable. By minimizing the number of roles, we minimize the complexity of the initiative, which in turn greatly improves its odds of success. This perspective tends to be counterintuitive for large companies that love operating with an extremely thin-grained division of labor. Large companies tend to favor extreme specialists that do one thing and one thing only. However, a supply chain is a system, and like all systems, it is the end-to-end perspective that matters.
Based on the experience acquired at Lokad at conducting these sorts of initiatives, we have identified four roles that usually represent the minimal viable division of labor to conduct the initiative: a supply chain executive, a data officer, a supply chain scientist, and a supply chain practitioner.
The role of the supply chain executive is to support the initiative so that it can happen in the first place. Getting a well-designed numerical recipe to drive the supply chain decisions in production represents a massive boost both in terms of profitability and productivity. However, it is also a lot of change to digest. It takes a lot of energy and support from top management for such a change to happen in a large organization.
The role of the data officer is to set up and maintain the data pipeline. The bulk of their contributions are expected to happen within the first two months of the initiative. If the data pipeline is correctly engineered, there is very little ongoing effort for the data officer afterward. The data officer is typically not involved much in the later stages of the initiative.
The role of the supply chain scientist is to craft the core numerical recipe. This role starts from the raw transactional data as made available by the data officer. No data preparation is expected from the data officer, only data extraction. The supply chain scientist’s role ends with taking ownership of the generated supply chain decision. It is not a piece of software that is responsible for the decision; it is the supply chain scientist. For every generated decision, the scientist themselves must be able to justify why this decision is adequate.
Finally, the role of the supply chain practitioner is to challenge the decisions generated by the numerical recipe and provide feedback to the supply chain scientist. The practitioner has no hope of taking the decision. This person has typically been in charge of those decisions so far, at least for a subscope, and usually with the help of spreadsheets and systems in place. In a small company, it is possible to have one person fulfilling both the role of the supply chain executive and the supply chain practitioner. It is also possible to bypass the need for a data officer if the data is readily accessible. This might happen in companies that are very mature as far as their data infrastructure is concerned. On the contrary, if the company is very large, it is possible to have a few, but only a tiny few, people filling each role.
The successful rollout in production of the core numerical recipe has quite an impact on the world of the supply chain practitioner. Indeed, to a large extent, the point of the initiative is to automate away the previous job of the supply chain practitioner. However, this does not imply that the best course of action is to fire those practitioners once the numerical recipe is in production. We will be revisiting this specific aspect in the next lecture.

Being organized doesn’t mean being efficient or being effective. There are roles that, despite being well-intentioned, add friction to supply chain initiatives, frequently to the point of making them fail altogether. Nowadays, the first role that contributes the most to making such initiatives fail tends to be the role of the data scientist, and even more so when a whole data science team is involved. By the way, Lokad learned this the hard way about a decade ago.
Despite the name similarity between data scientists and supply chain scientists, the two roles are actually very different. The supply chain scientist cares first and foremost about delivering real-world, production-grade decisions. If this can be achieved with a semi-trivial numerical recipe, even better; maintenance will be a breeze. The supply chain scientist takes full responsibility for dealing with the most minute details of the supply chain. Reliability and resilience to ambient chaos matter more than sophistication.
On the contrary, the data scientist focuses on the smart parts of the numerical recipe, the models, and the algorithms. The data scientist, in general terms, perceives themselves as an expert in machine learning and mathematical optimization. In terms of technologies, a data scientist is willing to learn the latest bleeding-edge open-source numerical toolkit, but this person is typically unwilling to learn about the three-decade-old ERP that happens to run the company. Also, the data scientist isn’t a supply chain expert, nor usually willing to become one. The data scientist attempts to deliver the best results according to agreed-upon metrics. The scientist has no ambition to deal with the very mundane details of the supply chain; those elements are expected to be handled by other people.
Involving data scientists spells doom for these initiatives because, as soon as data scientists are involved, the supply chain isn’t the focus anymore – algorithms and models are. Never underestimate the power of distraction that the latest model or algorithm represents for a smart, technologically-minded person.
The second role that tends to add friction to a supply chain initiative is the business intelligence (BI) team. When the BI team is part of the initiative, they tend to be a hindrance rather than anything else, although to a much lesser extent than the data science team. The problem with BI is mostly cultural. BI delivers reports, not decisions. The BI team is typically willing to produce endless walls of metrics as requested by every single division of the company. This is not the right attitude for a quantitative supply chain initiative.
Also, business intelligence as a piece of software is a very specific class of data analytics geared around cubes or OLAP cubes that let you slice and dice most in-memory systems in enterprise systems. This design is usually quite unfit to drive supply chain decisions.

Now that we have framed the initiative, let’s have a look at the high-level IT architecture that the initiative requires.

The schema on the screen illustrates a typical data pipeline setup for a quantitative supply chain initiative. In this lecture, I am discussing a data pipeline that does not support low latency requirements. We want to be able to complete a full cycle in about one hour, not one second. Most supply chain decisions, like purchase orders, do not require a low latency setup. Achieving end-to-end low latency requires a different kind of architecture, which is beyond the scope of today’s lecture.

The transaction systems represent the primary data source and the starting point of the data pipeline. These systems include the ERP, WMS, and EDI. They deal with the flow of goods such as purchasing, transport, production, and selling. These systems contain almost all the data that the core numerical recipe requires. For practically any sizeable company, these systems or their predecessors have been in place for at least two decades.
As these systems contain almost all the data we need, it would be tempting to implement the numerical recipe directly into these systems. Indeed, why not? By putting the numerical recipe right into the ERP, we would remove the need to go through the effort of setting up this entire data pipeline. Unfortunately, this does not work due to the very design of those transactional systems.
These transaction systems are invariably built with a transactional database at their core. This approach for the design of enterprise software has been exceedingly stable for the last four decades. Pick any random company, and chances are that every single business app in production has been implemented on top of a transactional database. Transactional databases offer four key properties that are known under the acronym ACID, which stands for Atomicity, Consistency, Isolation, and Durability. I’m not going to delve into the fine print of those properties, but suffice to say that these properties make the database very suitable for performing safely and concurrently many small read operations and many small write operations. The respective amounts of read operations and write operations are also expected to be fairly balanced.
However, the price to pay for those very useful ACID properties at the most granular level is that the transactional database is also very inefficient when it comes to servicing big read operations. A read operation that covers a sizable portion of the entire database, as a rule of thumb, if the data is serviced through a database that focuses on a very granular delivery of those ACID properties, then you can expect the cost of the computing resources to be inflated by a factor of 100 compared to architectures that don’t focus as much on those ACID properties at such a granular level. ACID is nice, but it comes at a massive premium.
Moreover, when someone attempts to read a sizable portion of the entire database, the database is likely to become unresponsive for a while as it dedicates the bulk of its resources to servicing this one big request. Many companies complain that their entire business systems are sluggish and that those systems frequently freeze for one second or more. Usually, this poor quality of service can be traced back to heavy SQL queries that attempt to read too many lines at once.
Therefore, the core numerical recipe cannot be allowed to operate in the same environment as the transactional systems that support production. Indeed, numerical recipes will need to access most of the data whenever they are run. Thus, the numerical recipe must be kept strictly isolated in its own subsystem, if only to avoid degrading the performance of those transactional systems further.
By the way, while it has been known for decades that it is a terrible idea to have a data-intensive process operating within a transactional system, this does not prevent most vendors of transaction systems (ERP, MRP, WMS) from selling integrated analytical modules, for example, inventory optimization modules. Having those modules integrated inevitably leads to quality of service problems while delivering underwhelming capabilities. All of those problems can be traced back to this single design problem: the transaction system and the analytical system must be kept in strict isolation.

The data lake is simple. It is a mirror of the transactional data geared towards very large read operations. Indeed, we have seen that transaction systems are optimized for many small read operations, not very large ones. Thus, in order to preserve the quality of service of the transactional system, the correct design consists of carefully replicating the transactional data into another system, namely the data lake. This replication must be implemented with care, precisely to preserve the quality of service of the transactional system, which typically means reading the data in very incremental ways and avoiding putting pressure spikes on the transactional system.
Once the relevant transactional data is mirrored into the data lake, the data lake itself serves all the data requests. An additional benefit of the data lake is its ability to serve multiple analytical systems. While we are discussing supply chain here, if marketing wants their own analytics, they will need this very same transactional data, and the same could be said for finance, sales, etc. Thus, instead of having every single department in the company implementing their own data extraction mechanism, it makes sense to consolidate all those extractions into the same data lake, the same system.
At the technical level, a data lake can be implemented with a relational database, typically tuned for big data extraction, adopting a columnar data storage. Data lakes can also be implemented as a repository of flat files served over a distributed file system. Compared to a transactional system, a data lake gives up on the fine-grained transactional properties. The goal is to serve a large amount of data as cheaply and as reliably as possible—nothing more, nothing less.
The data lake must mirror the original transactional data, which means copying without modifying anything. It is important not to prepare the data in the data lake. Unfortunately, the IT team in charge of setting up the data lake can be tempted to make things easier and simpler for other teams and thus prepare the data a little bit. However, modifying the data invariably introduces complications that undermine analytics at a later stage. In addition, sticking to a strict mirroring policy vastly diminishes the amount of effort needed for the IT team to set up and later maintain the data lake.
In companies where there is already a BI team in place, it can be tempting to use the BI systems as a data lake. However, I strongly advise against doing so and never use a BI setup as a data lake. Indeed, the data in BI systems (business intelligence systems) is invariably heavily transformed already. Leveraging the BI data to drive automated supply chain decisions is a recipe for garbage in, garbage out problems. The data lake must only be fed from primary data sources like ERP, not from secondary data sources like the BI system.

The analytical system is the one that contains the core numerical recipe. It is also the system that provides all the reports needed to instrument the decisions themselves. At the technical level, the analytical system contains the “smart bits,” like the machine learning algorithms and mathematical optimization algorithms. Although in practice, those smart bits are not dominating the codebase of the analytical systems. Usually, data preparation and data instrumentation take at least ten times as many lines of code as the parts dealing with learning and optimization.
The analytical system must be decoupled from the data lake because those two systems are completely at odds in terms of technological perspectives. As a piece of software, the data lake is expected to be very simple, very stable, and extremely reliable. On the contrary, the analytical system is expected to be sophisticated, under constant evolution, and extremely performant in terms of supply chain performance. Unlike the data lake, which must deliver near-perfect uptime, the analytical system does not even have to be up most of the time. For example, if we are considering daily inventory replenishment decisions, then the analytical system only has to run and be up once per day.
As a rule of thumb, it’s better to have the analytical system fail at producing decisions rather than generating incorrect decisions and letting them flow into production. Delaying supply chain decisions by a few hours, like purchase orders, is typically much less dire than taking incorrect decisions. As the design of the analytical system tends to be heavily influenced by the smart bits it contains, there is not necessarily much to be said in general about the design of the analytical system. However, there is at least one key design property that must be enforced for the ecosystem: this system must be stateless.
The analytical system must avoid having an internal state to the greatest extent possible. In other words, the entire ecosystem must start with the data as presented by the data lake and end with the generated intended supply chain decisions, along with supporting reports. What often happens is that whenever there is a component inside the analytical system that is too slow, like a machine learning algorithm, it is tempting to introduce a state, that is, to persist some information from the previous execution to speed up the next execution. However, doing so, relying on previously computed results as opposed to recomputing everything from scratch every single time, is dangerous.
Indeed, having a state within the analytical system puts the decision at risk. While data issues will inevitably arise and get fixed at the data lake level, the analytical system may still return decisions that are reflecting a problem that has already been fixed. For example, if a demand forecasting model is trained on a corrupt sales dataset, then the forecasting model remains corrupt until it is retrained over a fresh, corrected version of the dataset. The only way to avoid the analytical system suffering from echoes of data issues that have already been fixed in the data lake is to refresh everything every time. That is the essence of being stateless.
As a rule of thumb, if a part of the analytical system proves to be too slow to be replaced daily, then this part must be considered as suffering from a performance problem. Supply chains are chaotic, and there will be a day when something happens – a fire, a lockdown, a cyber attack – which will require immediate intervention. The company must be able to refresh all its supply chain decisions within one hour. The company must not wait and be stuck for 10 hours while the slow machine learning training phase is taking place.

In order to operate reliably, the analytical system must be properly instrumented. That is what the data health report and data inspectors are about. By the way, all those elements are the responsibility of the supply chain; they are not the responsibility of IT. Data health monitoring represents the very first data processing phase, even before the data preparation per se, and it happens within the analytical system. Data health is a part of the instrumentation of the numerical recipe. The data health report indicates whether it is acceptable or not to run the numerical recipe at all. This report also pinpoints the origin of the data problem, if any, in order to speed up the resolution of the problem.
Data health monitoring is a practice at Lokad. Over the last decade, this practice has proved to be invaluable in order to avoid garbage in, garbage out situations that seem to be ubiquitous in the world of enterprise software. Indeed, when a data crunching initiative fails, bad data is frequently put to blame. However, it is important to notice that usually, there is almost no engineering effort whatsoever to enforce data quality in the first place. Data quality does not fall from the sky; it takes engineering efforts.
The data pipeline that has been presented so far is pretty minimalistic. Data mirroring is as simple as it can get, which is a good thing as far as software quality is concerned. Yet, despite this minimalism, there are still many moving parts: many tables, many systems, many people. Thus, there are bugs all over the place. This is enterprise software, and the contrary would be quite surprising. Data health monitoring is in place to help the analytical system survive the ambient chaos.
Data health should not be confused with data cleaning. Data health is only about making sure that the data made available to the analytical system is a faithful representation of the transactional data that exists in the transaction systems. There is no attempt at fixing the data; the data is analyzed as is.
At Lokad, we typically distinguish low-level data health from high-level data health. Low-level data health is a dashboard that consolidates all the structural and volumetric oddities of the data, such as obvious problems like entries that are not even reasonable dates or numbers, for example, or orphan identifiers that are missing their expected counterparts. All these problems can be seen and are actually the easy ones. The difficult problem starts with issues that cannot be seen because the data is missing in the first place. For example, if something went wrong with a data extraction and the sales data extracted from yesterday only contains half of the expected lines, it can really endanger the production. Incomplete data is particularly insidious because it usually won’t prevent the numerical recipe from generating decisions, except that those decisions are going to be garbage, as the input data is incomplete.
Technically, at Lokad, we try to keep data health monitoring on a single dashboard, and this dashboard is typically intended for the IT team, as most of the problems captured by the low-level data health tend to be related to the data pipeline itself. Ideally, the IT team should be able to tell at a glance whether everything is okay or not and whether no further intervention is required.

High-level data health monitoring considers all the business-level oddities – elements that look wrong when observed from a business perspective. High-level data health covers elements such as negative stock levels or abnormally large minimum order quantities. It also covers things like prices that don’t make sense because the company would be operating at a loss or with ridiculously high margins. High-level data health attempts to cover all the elements where a supply chain practitioner would look at the data and say, “It can’t possibly be right; we have a problem.”
Unlike the low-level data health report, the high-level data health report is primarily intended for the supply chain team. Indeed, problems like anomalous minimum order quantities are only going to be perceived as problems by a practitioner who is somewhat familiar with the business environment. The point of this report is to be able to tell at a glance that everything is okay and that no further intervention is required.
Previously, I said that the analytical system was supposed to be stateless. Well, it turns out that data health is the exception that proves the rule. Indeed, many problems can be identified by comparing the present-day indicators with the same indicators collected over the previous days. Thus, data health monitoring will typically persist some kind of state, which are basically key indicators as observed over previous days, so that it can identify outliers in the present state of the data. However, as data health is a pure matter of monitoring, the worst that can happen if there is a problem at the data lake level that gets fixed, and then we have echoes of past problems in the state of the data health, is a series of false alarms from those reports. The logic that generates the supply chain decisions remains entirely stateless; the state only concerns a small part of the instrumentation.
Data health monitoring, both at the low and high levels, is a matter of trade-off between the risk of delivering incorrect decisions and the risk of not delivering decisions on time. When looking at large supply chains, it is not reasonable to expect that 100 percent of the data will be correct – incorrect transactional entries do happen, even if they are rare. Thus, there must be a volume of issues that should be deemed sufficiently low for the numerical recipe to operate. The trade-off between those two risks – being oversensitive to data glitches or being too tolerant to data issues – depends heavily on the economic makeup of the supply chain.
At Lokad, we craft and fine-tune these reports on a client-by-client basis. Instead of chasing every conceivable case of data corruption, the supply chain scientist, who is in charge of implementing the low-level and high-level data health and the data inspectors that I will be discussing in a minute, tries to tune the data health monitoring to be sensitive to the sort of problems that are actually damaging and actually happening for the supply chain of interest.

In Lokad jargon, a data inspector, or simply an inspector, is a report that consolidates all the relevant data concerning an object of interest. The object of interest is expected to be one of the first-class citizens from a supply chain perspective – a product, a supplier, a client, or a warehouse. For example, if we are considering a data inspector for products, then for any given product sold by the company, we should be able to see through the inspector on a single screen all the data that is attached to this product. In the data inspector for products, there are effectively as many views as there are products because when I say we see all the data, I mean all the data that is attached to one barcode or part number, not to all products in general.
Unlike the low-level and high-level data health reports that are expected to be two dashboards that can be inspected at a glance, inspectors are implemented to address questions and concerns that invariably arise while designing and then operating the core numerical recipe. Indeed, in order to take a supply chain decision, it is not infrequent to consolidate data from a dozen tables, possibly originating from multiple transactional systems. As the data is all over the place, when a decision looks suspicious, it is usually difficult to pinpoint the origin of the problem. There can be a disconnect between the data as seen by the analytical system and the data that exists in the transactional system. There can be a faulty algorithm that fails at capturing a statistical pattern in the data. There can be an incorrect perception, and the decision that is deemed suspicious might, in fact, be actually correct. In every case, the inspector is intended to offer the possibility to zoom into the object of interest.
In order to be useful, inspectors must reflect the specificities both of the supply chain and of the applicative landscape. As a result, crafting inspectors is almost invariably a bespoke exercise. Nevertheless, once the job is done, the inspector represents one of the pillars of the instrumentation of the analytical system itself.

In conclusion, while most quantitative supply chain initiatives are set to fail even before their kickoff, it doesn’t have to be that way. A careful choice of deliverables, timelines, scope, and rules is necessary to avoid problems that invariably set those initiatives for failure. Unfortunately, those choices are frequently somewhat counterintuitive, as Lokad learned the hard way through 14 years of operation so far.
The very start of the initiative must be dedicated to the setup of a data pipeline. An unreliable data pipeline is one of the surest ways to ensure that any data-driven initiative will fail. Most companies, even most IT departments, underappreciate the importance of a highly reliable data pipeline that doesn’t require ongoing firefighting. While the bulk of the setup of the data pipeline falls to the hands of the IT department, the supply chain itself must be responsible for the instrumentation of the analytical system it operates. Do not expect IT to do this for you; this one is on the supply chain team. We have seen two different types of instrumentation, namely the data health reports that adopt a company-wide perspective and the data inspectors, which support in-depth diagnostics.

Today, we discussed how to start an initiative, but next time, we’ll see how to end it or rather, hopefully, how to bring it to fruition. In the next lecture, which will happen on Wednesday, September 14th, we will move forward with our journey and see what sort of execution it takes to craft a core numerical recipe and then gradually bring the decisions it generates to production. We will also have a closer look at what this new way of doing supply chain implies for the day-to-day operation of the supply chain practitioners.
Now, let’s have a look at the questions.
Question: Why is it exactly six months as a time limit after which an implementation is not done correctly?
I would say the problem is not really having six months as a time limit. It is that, usually, initiatives are set up to fail from the get-go. That’s the problem. If your predictive optimization initiative starts with the perspective that results will be delivered in two years, it is almost a guarantee that the initiative will dissolve at some point and fail to deliver anything in production. If I could, I would prefer to have the initiative succeed in three months. However, six months represents the minimal timeline in my experience to get such an initiative to production. Any extra delay increases the risk of having the initiative fail. It is very difficult to compress this timeline further because once you’ve solved all the technical problems, the remaining delays reflect the time it takes for people to get into the motion of the initiative.
Question: Supply chain practitioners may get frustrated with an initiative that replaces the majority of their workload, such as the purchasing department, in conflict with decision automation. How would you advise handling this?
This is a very important question, which will be addressed hopefully in the next lecture. For today, what I can say is that I believe most of what supply chain practitioners are doing in present-day supply chains is not very rewarding. In most companies, people will get a set of SKUs or part numbers and then endlessly cycle through them, taking all the necessary decisions. This means that their job is essentially to look at a spreadsheet and cycle through it once a week or possibly once a day. This is not a fulfilling job.
The short answer is that the Lokad approach addresses the problem by automating all the mundane aspects of the work, so that the people in place with genuine expertise in the supply chain can start challenging the fundamentals of the supply chain. This allows them to discuss more with clients and suppliers to make everything more efficient. It’s about collecting insights so that we can improve the numerical recipe. Executing the numerical recipe is tedious, and there will be very few people who regret the old times when they had to cycle through spreadsheets every day.
Question: Are supply chain practitioners expected to work with data health reports in order to challenge the decisions generated by supply chain scientists?
Supply chain practitioners are expected to work with data inspectors, not data health reports. Data health reports are like a company-wide assessment that answers the question of whether the data at the entrance of the analytical system is good enough for a numerical recipe to operate on top of the dataset. The outcome of the data health report is a binary decision: green light the execution of the numerical recipe or oppose it and say there’s a problem that needs fixing. Data inspectors, which will be discussed more in the next lecture, are the entry point for supply chain practitioners to gain insights about a proposed supply chain decision.
Question: Is it feasible to update an analytical model, for example, setting an inventory policy on a daily basis? The supply chain system cannot respond to daily policy changes, won’t it just feed noise to the system?
To address the first part of the question, updating an analytical model on a daily basis is certainly feasible. For example, when Lokad was operating in 2020 with lockdowns taking place in Europe, we had countries closing and reopening with only 24 hours’ notice. This created an extremely chaotic situation that required constant immediate revisions on a daily basis. Lokad operated under this extreme pressure, managing lockdowns that were starting or ending daily across Europe for almost 14 months.
So, updating an analytical model daily is feasible, but not necessarily desirable. It is true that supply chain systems have a lot of inertia, and the first thing an appropriate numerical recipe must acknowledge is the ratchet effect of most decisions. Once you have ordered production to take place and raw materials are consumed, you cannot undo the production. You must take into account that many decisions have already been made when making new ones. However, when you realize your supply chain needs a drastic change in its course of action, there is no point in delaying this correction just for the sake of delaying the decision. The best time to implement the change is right now.
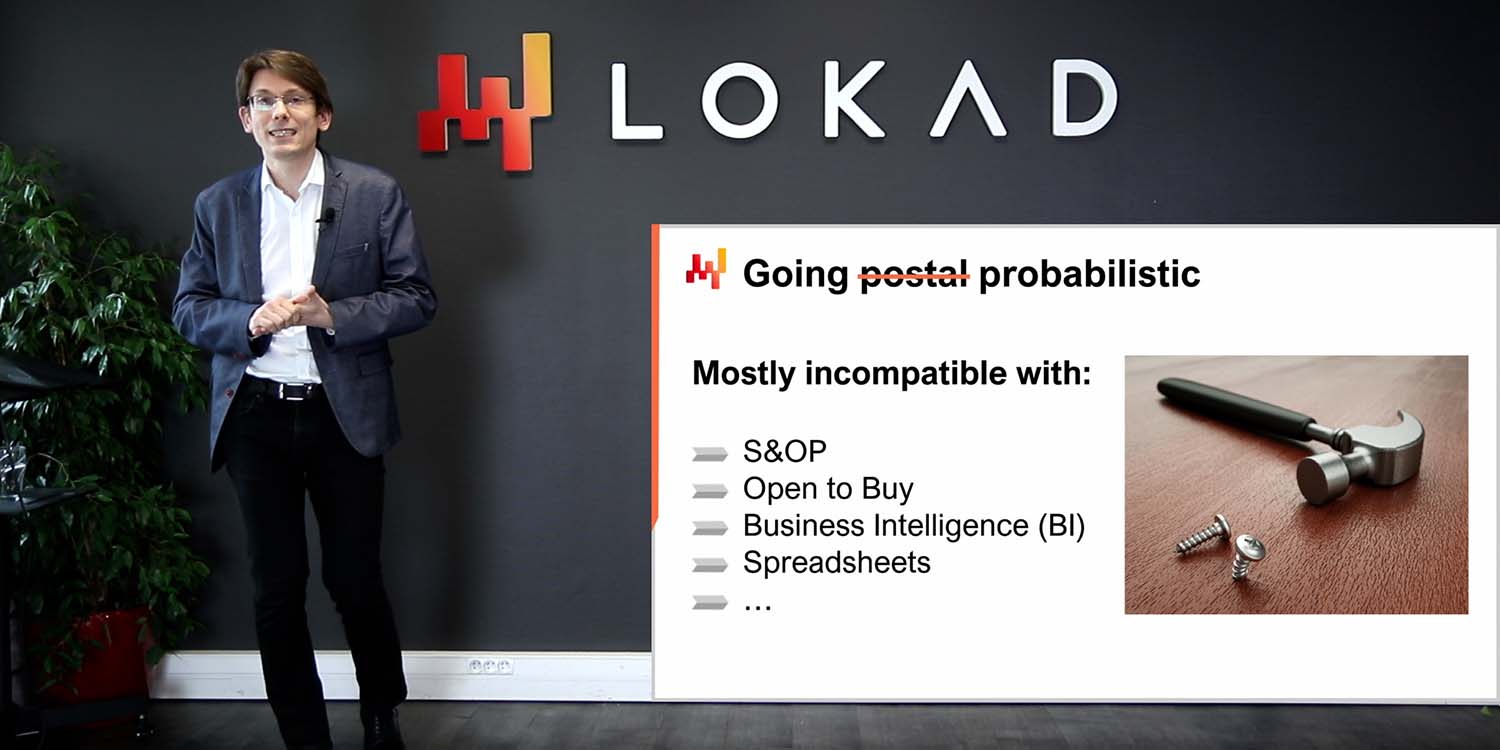
Regarding the noise aspect of the question, it comes down to the correct design of numerical recipes. There are many incorrect designs that are unstable, where small changes in the data generate large changes in the decisions representing the outcome of the numerical recipe. A numerical recipe should not be jumpy whenever there is a small fluctuation in the supply chain. This is why Lokad adopted a probabilistic perspective on forecasting. When using a probabilistic perspective, models can be engineered to be much more stable compared to models that try to capture the mean and are jumpy whenever an outlier occurs in the supply chain.
Question: One of the problems we face in supply chain with very large companies is their dependency on different source systems. Isn’t it extremely difficult to bring all data from these source systems under one unified system?
I completely agree that getting all the data is a significant challenge for many companies. However, we must ask ourselves why it is a challenge in the first place. As I mentioned earlier, 99% of the business applications operated by large companies nowadays rely on mainstream, well-engineered transactional databases. There might still be a few super legacy COBOL implementations running on arcane binary storage, but this is rare. The vast majority of business applications, even those deployed in the 1990s, operate with a clean production-grade transactional database in the backend.
Once you have a transactional backend, why should it be difficult to copy this data to a data lake? Most of the time, the problem is that companies don’t just try to copy the data – they try to do a lot more. They try to prepare and transform the data, often overcomplicating the process. Most modern database setups have built-in data mirroring capabilities, allowing you to replicate all changes from a transactional database to a secondary database. This is a built-in property for probably the top 20 most frequently used transactional systems in the market.
Companies tend to struggle with consolidating data because they try to do too much, and their initiatives collapse under their own complexity. Once the data is consolidated, companies often make the mistake of thinking that connecting the data should be done by IT, BI, or data science teams. The point I want to make here is that supply chain must be in charge of its own numerical recipes, just as marketing, sales, and finance should be. It should not be a transverse support division that tries to do this for the company. Connecting data from different systems typically requires tons of business insights. Large companies often fail because they try to have an expert from IT, BI, or data science teams do this job when it should be done within the division of interest.
Thank you very much for your time today, your interest, and your questions. See you next time after the summer, in September.